Verify ingestion
Confirm signals are arriving with up0 ingest test and up0 tail.
Verify ingestion
Two commands answer "is my pipeline working" without opening the dashboard. Both need a token from Ingestion tokens.
Send a synthetic signal
export UP0_INGEST_TOKEN=<UPZERO_INGEST_TOKEN>
up0 ingest test --signal traces --endpoint <UPZERO_OTLP_ENDPOINT>
up0 ingest test --signal logs --endpoint <UPZERO_OTLP_ENDPOINT>
up0 ingest test --signal metrics --endpoint <UPZERO_OTLP_ENDPOINT>
--endpoint overrides the endpoint the CLI would otherwise derive from your
org; pass it when you have not saved one on the active profile. Each call
sends one minimal, valid OTLP payload, then polls the Query API for up to 30
seconds to confirm the record is actually queryable, not just accepted:
✓ traces sent and found in the Query API.
✓ logs sent and found in the Query API.
✓ metrics sent and found in the Query API.
Failures are specific, not a generic "ingestion failed." Every rejection the Collector can return maps to one of these:
| What happened | up0 ingest test prints |
|---|---|
| Token not found, revoked or expired | ✗ Token rejected: not found, revoked, or expired. Run 'up0 tokens list' to check its status, or 'up0 tokens create' for a new one. |
Signal not in the token's allowed_signals | ✗ This token isn't scoped for '<signal>'. Allowed signals: <list>. Create a token with --signals <signal>,... or use a different one. |
Endpoint region does not match your org's data_region | ✗ Wrong region. Your org's data_region is '<region>' — use <correct>, not <endpoint used>. |
| Over the rate limit for this token | ✗ Rate limit exceeded for this token. Check current usage: up0 tokens list --output json |
| Network unreachable, DNS failure, timeout | ✗ Couldn't reach <endpoint>. Check network access and that the endpoint matches your org's data region. |
| Accepted, but not found on the Query API within 30s | ✗ Sent successfully but no record found after 30s. This usually means the Collector accepted it but processing is delayed — check up0 tail, or contact support if this persists. |
Real output from a rejected token, captured against a running stack:
✗ Token rejected: not found, revoked, or expired. Run 'up0 tokens list' to check its status, or 'up0 tokens create' for a new one.Watch it live
up0 tail --type logs --since 15m
up0 tail --type traces --since 15m
tail short-polls the Query API every 2 seconds and streams new records. It
follows and stays open when stdout is a terminal, and makes one bounded pass
when piped, redirected, or run with --json, so up0 tail | grep ERROR
does not hang forever. --service, --status and --query narrow the
stream; see the CLI reference for the full flag list.
Real output, a synthetic log and trace sent moments earlier:
$ up0 tail --type logs --since 15m
2026-09-16T12:55:43.209471Z INFO  up0-ingest-test-4f155436 up0-ingest-test

$ up0 tail --type traces --since 15m
up0-ingest-test-5e11a0cb up0-ingest-test 1000000ns Unset f67a8480db9c4598947ceb2e03dfbcfa
A bounded run that matches nothing says so on stderr rather than staying silent, naming the window and any active filters:
No logs in the last 15m (service=payments-api).What Explore shows
The console's Explore page reads the same data up0 tail streams. A query
against logs for the signal sent above:
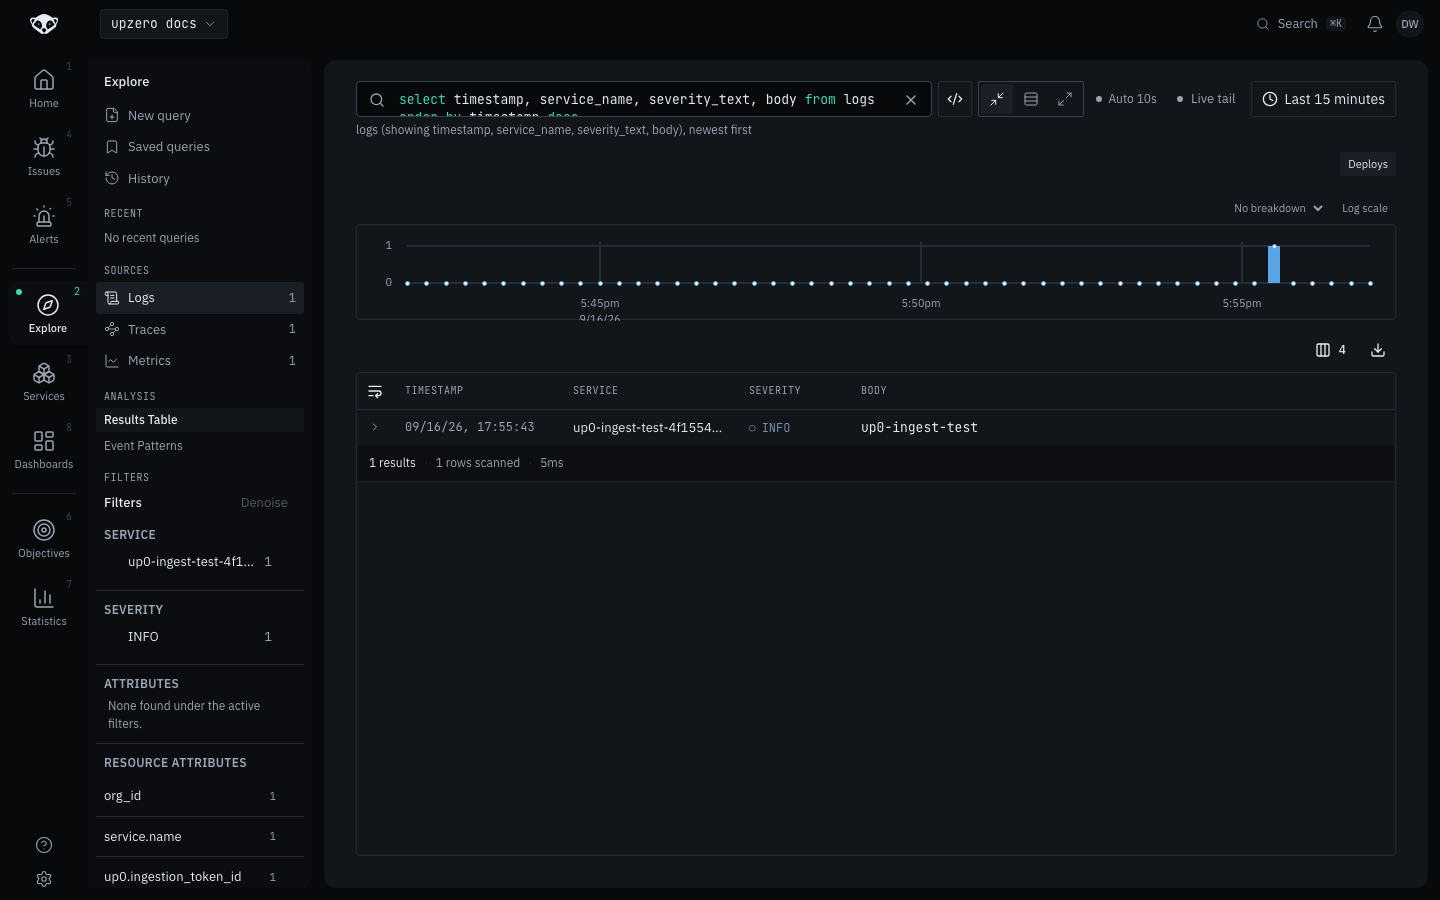
The row's Resource attributes carry org_id and
up0.ingestion_token_id, proof the Collector's authprocessor attributed the
record to your token, not just that a request was accepted.