Go
Send logs, traces and metrics from a Go program using the OpenTelemetry SDK.
Go
upzero ingests standard OTLP, so there is no upzero-specific package to
install. This guide wires the OpenTelemetry Go SDK to send logs, traces and
metrics, using the go/sdk
sample in up0-otel-examples as a walked, working reference.
Go has no auto-instrumentation agent (no equivalent of Python's
opentelemetry-instrument or an APM agent that wraps net/http for you), so
every span, log record and metric instrument in this guide is created by
hand. That is true of the Gin guide too, on top of
one piece of middleware.
Prerequisites
- Go 1.23 or later (the sample pins
go 1.26.0ingo.mod; anything reasonably current works). - An ingestion token with
traces,logsandmetricsin--signals.
Install
go get go.opentelemetry.io/otel \
  go.opentelemetry.io/otel/sdk \
  go.opentelemetry.io/otel/sdk/metric \
  go.opentelemetry.io/otel/sdk/log \
  go.opentelemetry.io/otel/exporters/otlp/otlptrace/otlptracehttp \
  go.opentelemetry.io/otel/exporters/otlp/otlpmetric/otlpmetrichttp \
  go.opentelemetry.io/otel/exporters/otlp/otlplog/otlploghttp \
  go.opentelemetry.io/contrib/bridges/otelslog
The last package is the logs bridge covered below. Everything else is the trace, metric and log SDKs plus their OTLP/HTTP exporters.
Configure
Every exporter's New(ctx) call, with no options, reads its configuration
from environment variables:
export OTEL_EXPORTER_OTLP_ENDPOINT=<UPZERO_OTLP_ENDPOINT>
export OTEL_EXPORTER_OTLP_PROTOCOL=http/protobuf
export OTEL_EXPORTER_OTLP_HEADERS="Authorization=Bearer <UPZERO_INGEST_TOKEN>"
export OTEL_SERVICE_NAME=my-go-service
<UPZERO_OTLP_ENDPOINT> and <UPZERO_INGEST_TOKEN> both come from
up0 tokens create (see Ingestion tokens); this
is the one place either value is real. Build the three providers from a
shared resource.Resource so service.name and the SDK's own
telemetry.sdk.* attributes land identically on every signal:
res, err := resource.New(ctx,
	resource.WithFromEnv(),      // OTEL_SERVICE_NAME, OTEL_RESOURCE_ATTRIBUTES
	resource.WithTelemetrySDK(), // telemetry.sdk.language=go, etc.
)

traceExporter, err := otlptracehttp.New(ctx)
tracerProvider := sdktrace.NewTracerProvider(
	sdktrace.WithBatcher(traceExporter),
	sdktrace.WithResource(res),
)
otel.SetTracerProvider(tracerProvider)
Never these two things
No real endpoint host outside the token-create output. No
otlptracehttp.WithInsecure() (or the metric/log exporters' equivalent)
against <UPZERO_OTLP_ENDPOINT> (every regional endpoint is TLS-only), and
that option exists for pointing an exporter at a local, unencrypted
Collector.
OTEL_EXPORTER_OTLP_PROTOCOL=http/protobuf selects the HTTP exporters shown
above. All three (otlptracehttp, otlpmetrichttp, otlploghttp) also have
gRPC counterparts (otlptracegrpc, otlpmetricgrpc, otlploggrpc) that read
the same environment variables if you would rather send over gRPC.
Because a short-lived program can exit before its batch processor's next
flush interval, force-flush and shut down every provider before returning
from main, not just the tracer:
defer func() {
	ctx, cancel := context.WithTimeout(context.Background(), 10*time.Second)
	defer cancel()
	tracerProvider.ForceFlush(ctx)
	tracerProvider.Shutdown(ctx)
	meterProvider.ForceFlush(ctx)
	meterProvider.Shutdown(ctx)
	loggerProvider.ForceFlush(ctx)
	loggerProvider.Shutdown(ctx)
}()
A long-running server does not strictly need the ForceFlush calls (its
batch processors flush on their own interval), but calling them on shutdown
still avoids losing whatever is sitting in the batch buffer when the process
exits. See the Gin guide for the server case.
Logs
Go has no standard logging framework the way Python has logging, but it
does have log/slog in the standard library since Go 1.21, and
go.opentelemetry.io/contrib/bridges/otelslog bridges it straight into the
OTel Logs Bridge API. Build a *slog.Logger from your logger provider once:
import "go.opentelemetry.io/contrib/bridges/otelslog"

logger := otelslog.NewLogger("my-go-service", otelslog.WithLoggerProvider(loggerProvider))
Then log with the *Context methods, not the plain ones. logger.InfoContext(ctx, ...) and logger.ErrorContext(ctx, ...) read the active span out of ctx
and attach its trace_id/span_id to the emitted record automatically;
logger.Info(...) (no context) does not, and the record arrives
uncorrelated:
logger.InfoContext(ctx, "work cycle complete",
	"cycle.iteration", iteration,
	"cycle.items", items,
)
The sample's own log lines use this exact shape in runWorkCycle and
triggerError; nothing in the sample builds an
go.opentelemetry.io/otel/log.Record by hand.
Traces
Get a tracer from the global provider and start spans the same way any Go OTel program does:
tracer := otel.Tracer("my-go-service")

ctx, span := tracer.Start(ctx, "work-cycle", trace.WithSpanKind(trace.SpanKindInternal))
defer span.End()
span.SetAttributes(attribute.Int("cycle.iteration", iteration))
span.SetStatus(codes.Ok, "")
For an error path, record the error on the span and set its status
explicitly. Unlike some languages' SDKs, the Go SDK does not infer ERROR
status from a returned error value:
err := errors.New("boom: deliberate example failure")
span.RecordError(err)
span.SetStatus(codes.Error, err.Error())
The sample nests a compute-batch child span inside each work-cycle span,
so a query in Explore for service.name = my-go-service shows the full
parent/child tree, not one flat span per iteration.
Metrics
Create instruments from a meter, once, and reuse them across calls (creating a new counter on every iteration duplicates the instrument rather than accumulating into one):
meter := otel.Meter("my-go-service")

itemsProcessed, err := meter.Int64Counter(
	"work.items.processed",
	metric.WithDescription("Number of work items processed per compute-batch iteration"),
	metric.WithUnit("1"),
)

cycleDuration, err := meter.Float64Histogram(
	"work.cycle.duration",
	metric.WithDescription("Duration of each work-cycle iteration"),
	metric.WithUnit("ms"),
)

itemsProcessed.Add(ctx, int64(items))
cycleDuration.Record(ctx, durationMS)
Verify
Run the sample against a real ingestion token and confirm the three signals land.
cd go/sdk
export OTEL_EXPORTER_OTLP_ENDPOINT=<UPZERO_OTLP_ENDPOINT>
export OTEL_EXPORTER_OTLP_PROTOCOL=http/protobuf
export OTEL_EXPORTER_OTLP_HEADERS="Authorization=Bearer <UPZERO_INGEST_TOKEN>"
export OTEL_SERVICE_NAME=up0-example-go-sdk
go run .
The program exits 0 silently on success; it never prints anything of its
own. Confirm the data actually landed with up0 tail:
$ up0 tail --type logs --since 15m --service up0-example-go-sdk
2026-09-16T13:18:24.877734Z INFO  up0-example-go-sdk work cycle complete (iteration=1, items=11, duration_ms=50.78)
2026-09-16T13:18:24.928469Z INFO  up0-example-go-sdk work cycle complete (iteration=2, items=12, duration_ms=50.69)
2026-09-16T13:18:24.979537Z INFO  up0-example-go-sdk work cycle complete (iteration=3, items=13, duration_ms=51.04)
2026-09-16T13:18:25.030409Z INFO  up0-example-go-sdk work cycle complete (iteration=4, items=14, duration_ms=50.83)
2026-09-16T13:18:25.081543Z INFO  up0-example-go-sdk work cycle complete (iteration=5, items=15, duration_ms=51.09)
2026-09-16T13:18:25.081590Z ERROR up0-example-go-sdk boom: deliberate example failure occurred

$ up0 tail --type traces --since 15m --service up0-example-go-sdk
up0-example-go-sdk compute-batch 50743375ns Ok ce76268875a39b32961b867e7b205f40
up0-example-go-sdk work-cycle 50916791ns Ok ce76268875a39b32961b867e7b205f40
up0-example-go-sdk compute-batch 50673916ns Ok 21db241f7b8f20a493b18c7d64766898
up0-example-go-sdk work-cycle 50722709ns Ok 21db241f7b8f20a493b18c7d64766898
up0-example-go-sdk boom 25000ns Error 52177d280ac3bc090cc61d1c0f7a2a97
Metrics do not stream through up0 tail (it covers logs and traces only);
confirm them with up0 metrics ls:
$ up0 metrics ls --since 15m
┏━━━━━━━━━━━━━━━━━━━━━━┳━━━━━━━━━━━┳━━━━━━━━━━━━━━┓
┃ metric_name          ┃ metric_type ┃ series_count ┃
┡━━━━━━━━━━━━━━━━━━━━━━╇━━━━━━━━━━━╇━━━━━━━━━━━━━━┩
│ work.cycle.duration  │ histogram │           12 │
│ work.items.processed │ counter   │           12 │
└──────────────────────┴───────────┴──────────────┘
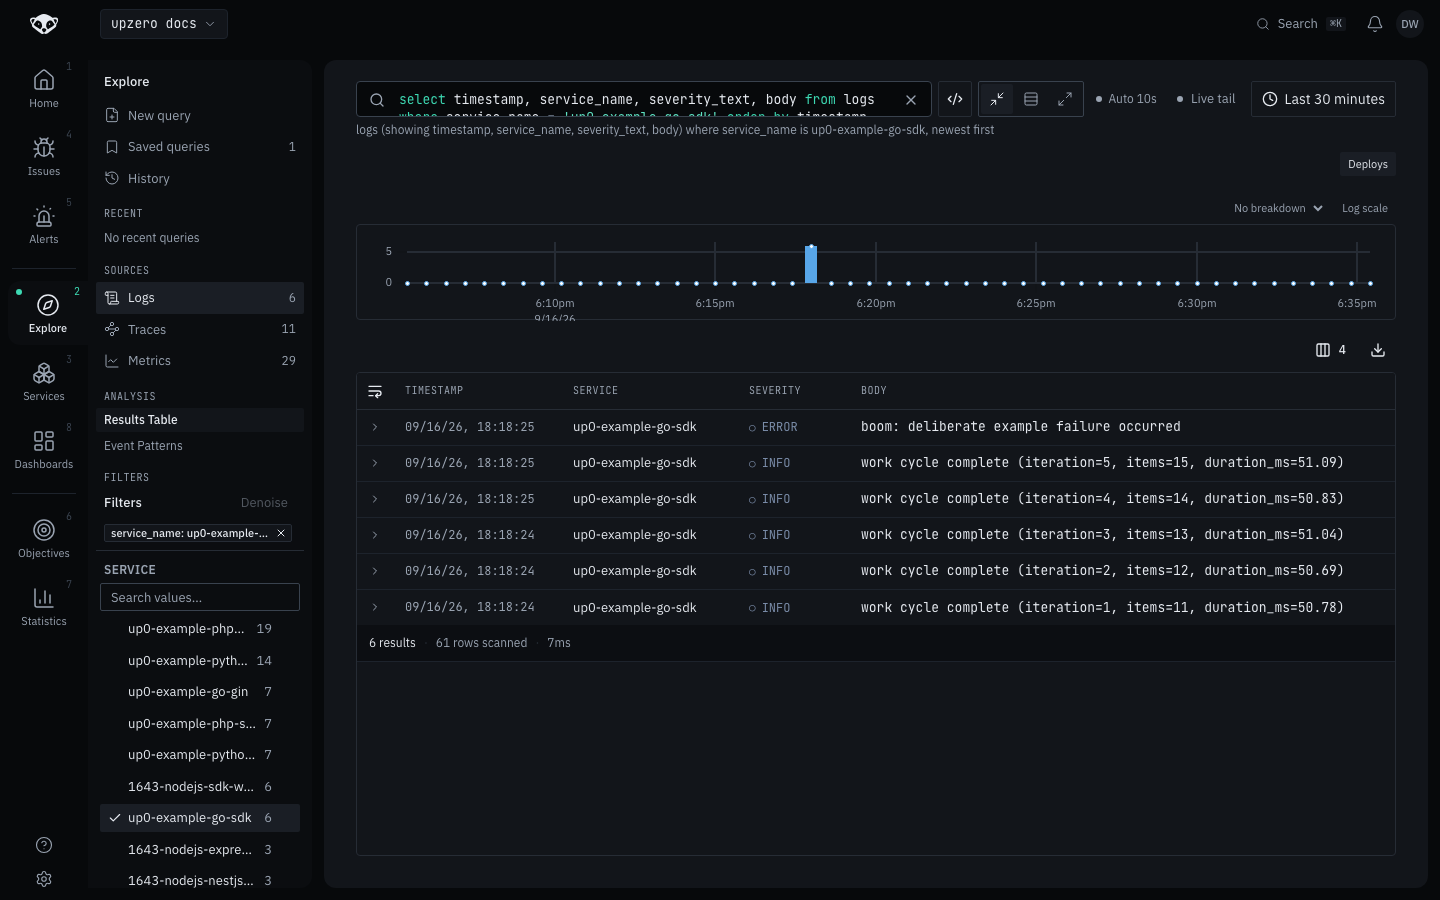
And in Explore, a logs query filtered to service_name = up0-example-go-sdk
shows the five INFO records and the one ERROR record from the same run:
Troubleshooting
Nothing shows up, and the program exits 0 with no error. The most common
cause is forgetting ForceFlush before exit: otlptracehttp,
otlpmetrichttp and otlploghttp all batch, and a short-lived program that
returns from main without flushing loses whatever was still buffered. The
sample's shutdown function force-flushes all three providers before
Shutdown; if you strip that out to simplify your own code, this is the
failure you will hit.
Logs arrive but have no trace_id/span_id. This happens when
logger.Info(...) is called instead of logger.InfoContext(ctx, ...). The
plain (non-Context) slog.Logger methods do not carry a context.Context
at all, so the otelslog handler has nothing to read a span out of. Always
use the *Context variant inside a span.