Go + Gin
Add request-level tracing to a Gin service on top of the Go SDK guide.
Go + Gin
This guide assumes the Go SDK guide and adds one
piece of Gin-specific middleware: otelgin.Middleware, which produces a
SERVER span per request. It is the only piece of automatic instrumentation in
this guide, because Go has none of its own; everything else is the same
hand-written span, log and metric code the SDK guide covers, adapted from an
in-process loop to a per-request handler. The walked, working reference is
the go/gin
sample in up0-otel-examples.
Prerequisites
- Everything in the Go SDK guide's prerequisites.
- An existing
net/http-compatible Gin service, or the sample above to run as-is.
Install
go get github.com/gin-gonic/gin \
  go.opentelemetry.io/contrib/instrumentation/github.com/gin-gonic/gin/otelgin \
  go.opentelemetry.io/contrib/instrumentation/net/http/otelhttp
otelgin is the request-span middleware. otelhttp is optional and only
needed if your handlers themselves make outbound HTTP calls you want traced
(the sample uses it for one, covered under Traces below).
Configure
Identical to the SDK guide: build a
shared resource.Resource, then a TracerProvider, MeterProvider and
LoggerProvider from <UPZERO_OTLP_ENDPOINT> and <UPZERO_INGEST_TOKEN> via
the OTEL_EXPORTER_OTLP_* environment variables. Nothing about that setup
changes for a server versus a one-shot program, except when you flush:
router := newRouter(tracer, logger, itemsProcessed, cycleDuration)
srv := &http.Server{Addr: ":8080", Handler: router}

go srv.ListenAndServe()

stopCtx, stop := signal.NotifyContext(context.Background(), os.Interrupt, syscall.SIGTERM)
defer stop()
<-stopCtx.Done()

srv.Shutdown(shutdownCtx)
// then ForceFlush + Shutdown on all three providers, same as the SDK guide
A long-running server's batch processors flush on their own interval, so
losing a few seconds of buffered telemetry on an unclean kill is a smaller
risk than in a one-shot script. Flushing on a clean SIGTERM/SIGINT shutdown
still avoids losing whatever the last batch window was holding.
Never these two things
No real endpoint host outside the token-create output. No
otlptracehttp.WithInsecure() (or the metric/log exporters' equivalent)
against <UPZERO_OTLP_ENDPOINT>.
Logs
Same otelslog bridge as the SDK guide: build a *slog.Logger once from the
logger provider and log with the *Context methods so the record picks up
the request's span automatically.
logger.InfoContext(ctx, "work cycle complete",
	"cycle.items", items,
	"cycle.downstream_status", downstreamStatus,
)
Inside a Gin handler, ctx is c.Request.Context() (or a child context from
a span you started off it), which already carries the otelgin-created
SERVER span, so a log call anywhere in the request path correlates to that
span with no extra wiring.
Traces
Register the middleware once, before your routes:
router := gin.New()
router.Use(gin.Recovery())
router.Use(otelgin.Middleware(""))
The empty string is the service name override; leave it empty to use the
TracerProvider's resource service.name. Every route now gets a SERVER
span automatically, carrying http.request.method, http.route and
http.response.status_code (the current stable HTTP semantic conventions;
older OTel examples you may find elsewhere show http.method and
http.status_code, which were renamed).
Everything a handler does with c.Request.Context() nests under that SERVER
span:
func handleWork(c *gin.Context, tracer trace.Tracer, /* ... */) {
	ctx, span := tracer.Start(c.Request.Context(), "work-cycle", trace.WithSpanKind(trace.SpanKindInternal))
	defer span.End()
	// ...
}
For an outbound HTTP call you want as a CLIENT span in the same trace, wrap
the http.Client's Transport with otelhttp.NewTransport rather than
writing the span by hand:
client := http.Client{Transport: otelhttp.NewTransport(http.DefaultTransport)}
req, _ := http.NewRequestWithContext(ctx, http.MethodGet, url, nil)
resp, err := client.Do(req)
This is still "manual" in the sense the SDK guide's introduction means: it is a deliberate import and explicit wiring in your code, not bytecode an agent injects at process startup (Go has no such agent, unlike Java's or .NET's).
Metrics
Same as the SDK guide: create counters and histograms once from a meter, not per request, and record into them from inside the handler.
itemsProcessed.Add(ctx, int64(items))
cycleDuration.Record(ctx, durationMS)
Verify
Run the sample and drive some traffic:
cd go/gin
export OTEL_EXPORTER_OTLP_ENDPOINT=<UPZERO_OTLP_ENDPOINT>
export OTEL_EXPORTER_OTLP_PROTOCOL=http/protobuf
export OTEL_EXPORTER_OTLP_HEADERS="Authorization=Bearer <UPZERO_INGEST_TOKEN>"
export OTEL_SERVICE_NAME=up0-example-go-gin
go run ./src
for i in 1 2 3 4 5; do curl http://localhost:8080/work; echo; done
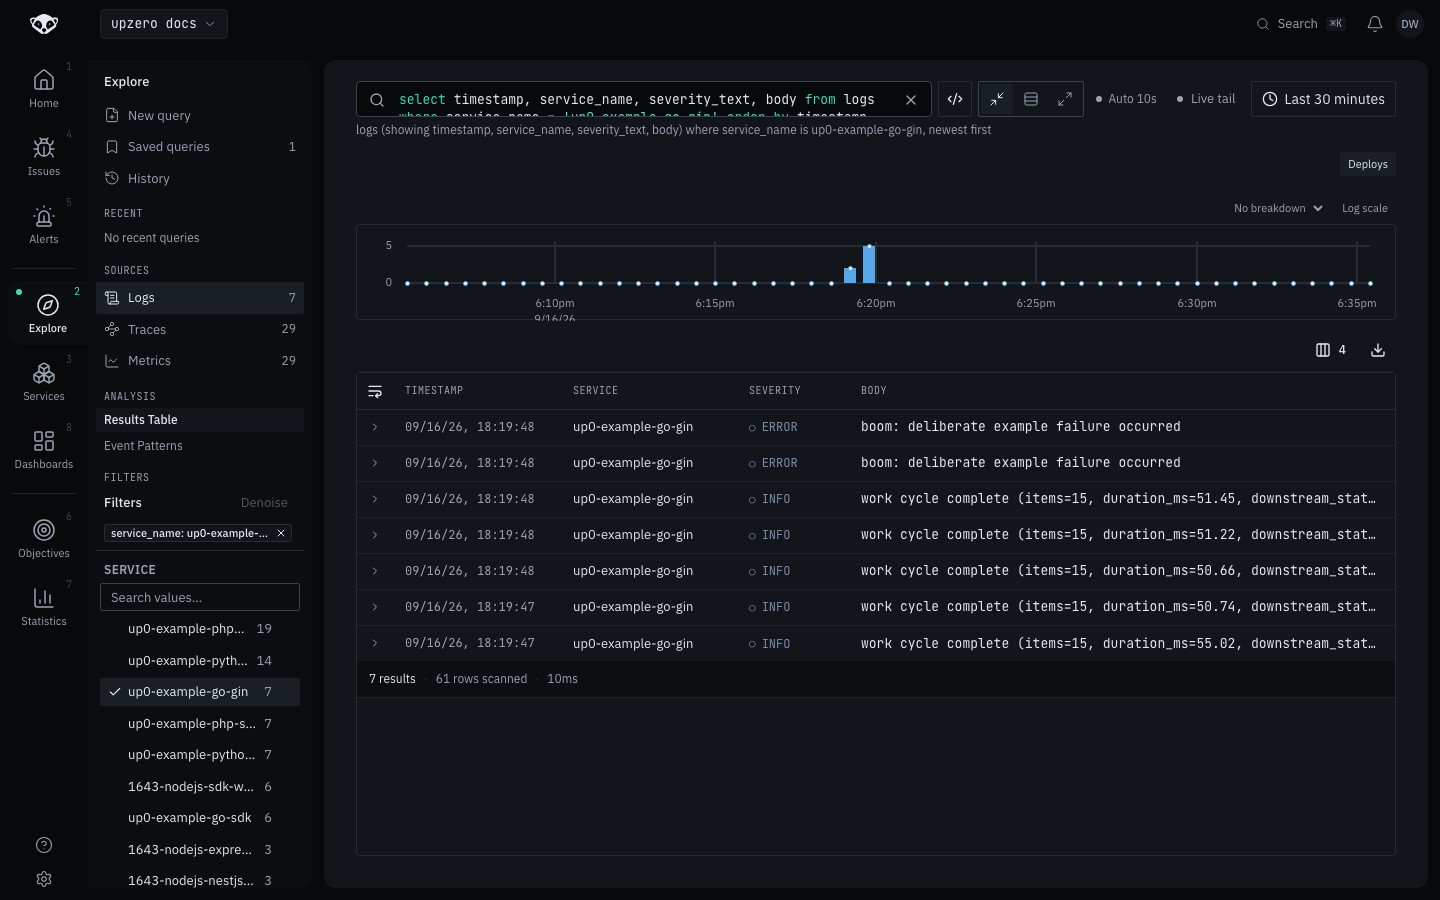
for i in 1 2; do curl http://localhost:8080/error; echo; done$ up0 tail --type logs --since 15m --service up0-example-go-gin
2026-09-16T13:19:47.927755Z INFO up0-example-go-gin work cycle complete (items=15, duration_ms=55.02, downstream_status=200)
2026-09-16T13:19:47.993774Z INFO up0-example-go-gin work cycle complete (items=15, duration_ms=50.74, downstream_status=200)
2026-09-16T13:19:48.204491Z ERROR up0-example-go-gin boom: deliberate example failure occurred
$ up0 tail --type traces --since 15m --service up0-example-go-gin
up0-example-go-gin work-cycle 51474292ns Ok c7dd7cc30f3045f810e5f0078938ebdc
up0-example-go-gin GET /internal/echo 20458ns Unset 4d3022692c4e3571236e2c1774ea11c8
up0-example-go-gin GET /work 50797250ns Unset b1596ca4bb2452e660bbcd535ab4ed6f
up0-example-go-gin GET /error 111042ns Error 44a066828b94d2e222d8b048e0d2f6df
up0-example-go-gin boom 56375ns Error 44a066828b94d2e222d8b048e0d2f6df
up0-example-go-gin HTTP GET 3706209ns Unset 13e40dc6b6a2c57e337b380075fe8f0cGET /internal/echo is the loopback target of the outbound HTTP GET CLIENT
span, both real network round trips through the Go HTTP stack, giving the
waterfall a genuine SERVER to CLIENT to SERVER shape rather than one flat
bar. up0 metrics ls shows work.items.processed and work.cycle.duration
the same way the SDK guide's does.
In Explore, the GET /work trace shows the full tree: the root SERVER span,
work-cycle, compute-batch with its batch.checkpoint event, and the
nested CLIENT/SERVER pair for the loopback call.
Troubleshooting
GET /work returns 200 but the trace has no CLIENT span. Confirm the
http.Client used for the outbound call has Transport: otelhttp.NewTransport(http.DefaultTransport) set, and that the request was
built with http.NewRequestWithContext(ctx, ...) using the handler's
request-scoped ctx, not context.Background(). A plain http.Get(url)
call has no transport to wrap and produces no span.
The root span's status is Unset on a request that returned 500.
otelgin derives the SERVER span's status from the final response status
code once the handler has written it, so this only happens if the handler
wrote the response body before setting the error status, or wrote to
c.Writer directly instead of going through c.JSON/c.String. The sample's
handleError returns c.JSON(http.StatusInternalServerError, ...), which
otelgin reads correctly.