PHP
Send logs, traces and metrics from a PHP script using the OpenTelemetry SDK.
PHP
upzero ingests standard OTLP, so there is no upzero-specific package to
install. This guide wires the OpenTelemetry PHP SDK to send logs, traces and
metrics, using the php/sdk
sample in up0-otel-examples as a walked, working reference.
Every PHP CLI invocation is a fresh, short-lived process: there is no background thread that keeps batching and exporting telemetry after your script's own logic finishes, the way there is in a long-running server. If the process exits without an explicit flush, whatever the OTLP exporters were still holding in their batch buffers is gone. The Verify section below is built around that.
Prerequisites
- PHP 8.2 or later.
- Composer.
- An ingestion token with
traces,logsandmetricsin--signals. - Optionally, the
opentelemetryPECL extension. It is not required to send data (see the two Composer tabs below), but without it any outbound HTTP call your script makes has to be traced by hand rather than picked up automatically.
Install
The SDK, its OTLP exporter, and Guzzle (the HTTP client the sample and this
guide use) are required either way. Whether you also install the
ext-opentelemetry-dependent auto-instrumentation package for Guzzle depends
on whether that PECL extension is available in your environment:
composer require open-telemetry/api open-telemetry/sdk open-telemetry/exporter-otlp \
  open-telemetry/opentelemetry-auto-guzzle guzzlehttp/guzzle
Requires the opentelemetry PECL extension installed and enabled
(php -m | grep opentelemetry). It hooks GuzzleHttp\Client::transfer() via
zend_observer, so any outbound Guzzle call gets a CLIENT span with zero
span code of your own. The sample's Dockerfile installs it with
docker-php-extension-installer
rather than raw pecl install, since pecl.php.net is in maintenance mode:
ADD https://github.com/mlocati/docker-php-extension-installer/releases/latest/download/install-php-extensions /usr/local/bin/install-php-extensions
RUN chmod +x /usr/local/bin/install-php-extensions \
    && install-php-extensions opentelemetry
Either way, the TracerProvider/MeterProvider/LoggerProvider setup below is identical: the SDK's own env-based autoloader builds all three, and neither Composer path changes that.
Configure
Set OTEL_PHP_AUTOLOAD_ENABLED=true and the SDK builds every provider from
environment variables with no PHP setup code of your own:
export OTEL_PHP_AUTOLOAD_ENABLED=true
export OTEL_SERVICE_NAME=my-php-service
export OTEL_TRACES_EXPORTER=otlp
export OTEL_METRICS_EXPORTER=otlp
export OTEL_LOGS_EXPORTER=otlp
export OTEL_EXPORTER_OTLP_PROTOCOL=http/protobuf
export OTEL_EXPORTER_OTLP_ENDPOINT=<UPZERO_OTLP_ENDPOINT>
export OTEL_EXPORTER_OTLP_HEADERS="Authorization=Bearer <UPZERO_INGEST_TOKEN>"
<UPZERO_OTLP_ENDPOINT> and <UPZERO_INGEST_TOKEN> both come from
up0 tokens create (see Ingestion tokens); this
is the one place either value is real.
Never these two things
No real endpoint host outside the token-create output. No
OTEL_EXPORTER_OTLP_INSECURE=true against <UPZERO_OTLP_ENDPOINT> (every
regional endpoint is TLS-only), and that variable exists for pointing at a
local, unencrypted Collector.
Get the tracer, meter and logger from Globals, not by constructing
providers yourself:
use OpenTelemetry\API\Globals;

$tracer = Globals::tracerProvider()->getTracer('my-php-service');
$meter = Globals::meterProvider()->getMeter('my-php-service');
$logger = Globals::loggerProvider()->getLogger('my-php-service');
Then, before the script exits, flush and shut down all three. This is the line every PHP CLI example exists to justify:
foreach ([Globals::tracerProvider(), Globals::meterProvider(), Globals::loggerProvider()] as $provider) {
    if (method_exists($provider, 'forceFlush')) {
        $provider->forceFlush();
    }
    if (method_exists($provider, 'shutdown')) {
        $provider->shutdown();
    }
}
Skip this and whatever the exporters were still batching when the process exits is simply lost, no error printed.
Logs
Build a log record with logRecordBuilder() and emit() it inside an active
span's scope. The builder defaults to the current context, so a record
emitted while a span is active correlates to it with no explicit
trace_id/span_id wiring:
$logger->logRecordBuilder()
    ->setSeverityNumber(Severity::INFO)
    ->setSeverityText('INFO')
    ->setBody(sprintf(
        'work cycle complete (iteration=%d, items=%d, duration_ms=%.2f)',
        $iteration, $items, $durationMs,
    ))
    ->emit();
For an error, attach the exception with setException() so it appears
alongside the severity:
$logger->logRecordBuilder()
    ->setSeverityNumber(Severity::ERROR)
    ->setSeverityText('ERROR')
    ->setBody('boom: deliberate example failure occurred')
    ->setException($exception)
    ->emit();
Traces
Start a span, activate it (so nested code and log calls see it as current),
and end it in a finally block so it always closes:
$span = $tracer->spanBuilder('work-cycle')
    ->setSpanKind(SpanKind::KIND_INTERNAL)
    ->startSpan();
$scope = $span->activate();

try {
    $span->setAttribute('cycle.iteration', $iteration);
    // ... do the work, emit the log above ...
    $span->setStatus(StatusCode::STATUS_OK);
} finally {
    $scope->detach();
    $span->end();
}
For an error path, record the exception and set the status explicitly:
try {
    throw new RuntimeException('boom: deliberate example failure');
} catch (RuntimeException $exception) {
    $span->recordException($exception);
    $span->setStatus(StatusCode::STATUS_ERROR, $exception->getMessage());
} finally {
    $scope->detach();
    $span->end();
}
With the C extension, an outbound GuzzleHttp\Client call needs no span
code at all; opentelemetry-auto-guzzle produces the CLIENT span by hooking
Client::transfer():
$client = new Client(['timeout' => 5]);
$response = $client->request('GET', $target);
Without it, wrap the same call in a hand-written span the same way the
work-cycle span above is written, since there is no hook to do it for you.
Metrics
Create instruments from the meter once and reuse them:
$itemsProcessedCounter = $meter->createCounter(
    'work.items.processed',
    unit: '1',
    description: 'Number of work items processed per compute-batch iteration',
);
$cycleDurationHistogram = $meter->createHistogram(
    'work.cycle.duration',
    unit: 'ms',
    description: 'Duration of each work-cycle iteration',
);

$itemsProcessedCounter->add($items, ['cycle.iteration' => $iteration]);
$cycleDurationHistogram->record($durationMs, ['cycle.iteration' => $iteration]);
Verify
Run the sample against a real ingestion token:
cd php/sdk
composer install
export OTEL_PHP_AUTOLOAD_ENABLED=true
export OTEL_SERVICE_NAME=up0-example-php-sdk
export OTEL_TRACES_EXPORTER=otlp
export OTEL_METRICS_EXPORTER=otlp
export OTEL_LOGS_EXPORTER=otlp
export OTEL_EXPORTER_OTLP_PROTOCOL=http/protobuf
export OTEL_EXPORTER_OTLP_ENDPOINT=<UPZERO_OTLP_ENDPOINT>
export OTEL_EXPORTER_OTLP_HEADERS="Authorization=Bearer <UPZERO_INGEST_TOKEN>"
php src/main.php
The sample built and ran in Docker for this walk (php:8.2-cli plus the
opentelemetry extension), since it needs PHP 8.2+. It exits 0 on success
and prints nothing of its own. Confirm the data landed:
$ up0 tail --type logs --since 15m --service up0-example-php-sdk
2026-09-16T13:25:40.046664Z INFO  up0-example-php-sdk work cycle complete (iteration=1, items=11, duration_ms=52.53)
2026-09-16T13:25:40.097110Z INFO  up0-example-php-sdk work cycle complete (iteration=2, items=12, duration_ms=50.29)
2026-09-16T13:25:40.269671Z ERROR up0-example-php-sdk boom: deliberate example failure occurred
2026-09-16T13:25:40.476141Z INFO  up0-example-php-sdk downstream http call complete (target=https://example.com, status=200)

$ up0 tail --type traces --since 15m --service up0-example-php-sdk
up0-example-php-sdk compute-batch 50695375ns Ok 8d7dd1b0084ed459d32324dec9565b08
up0-example-php-sdk work-cycle 52060875ns Ok 8d7dd1b0084ed459d32324dec9565b08
up0-example-php-sdk boom 17218875ns Error 1dacac47b710bea942ee95a0c7430916
up0-example-php-sdk GET 201250709ns Unset fed1b71333f000cdd8511d6dffd39659
The last line, GET, is the auto-instrumented Guzzle CLIENT span from the
"with the C extension" path. up0 metrics ls shows
work.items.processed and work.cycle.duration the same way the Go guide's
does; up0 tail covers logs and traces only.
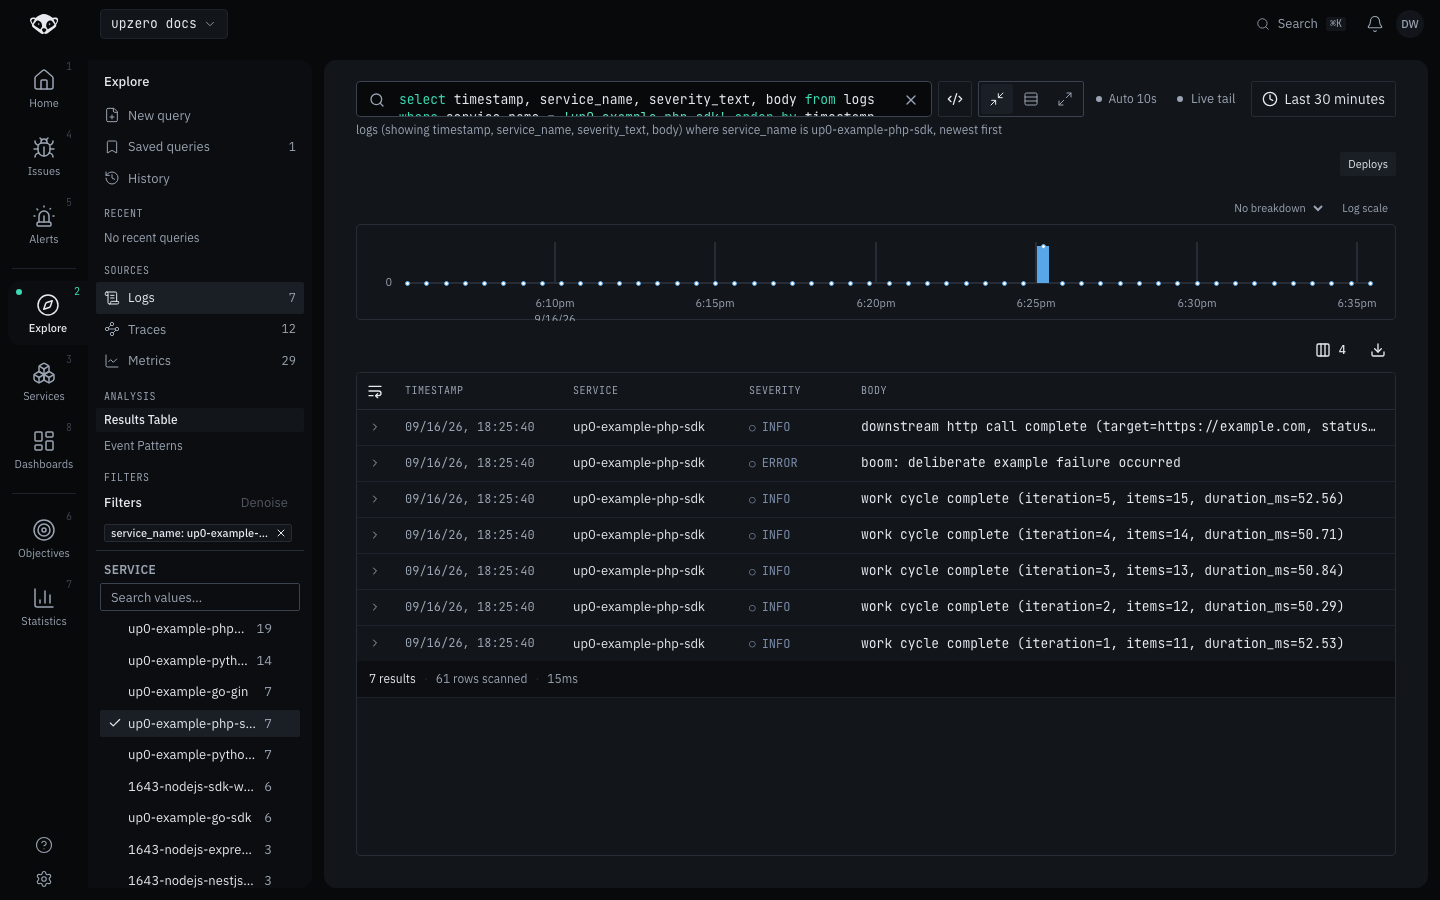
In Explore, a logs query filtered to service_name = up0-example-php-sdk
shows the same records:
Troubleshooting
Nothing shows up, and the script exits 0 with no error. The flush sequence in Configure was skipped, or the script exited before reaching it (an uncaught exception, for instance). Wrap the whole script body so the flush block always runs, even on an error path.
cURL error 60: SSL certificate problem: unable to get local issuer
certificate. Seen while walking this guide against a local kind cluster
whose TLS certificate is signed by a locally trusted root, not a public CA:
PHP's curl extension uses the system CA bundle, which does not include
that root by default inside a fresh container. This is a local-cluster
detail, not something a real deployment hits. A real upzero endpoint's
certificate chains to a public root your system trust store already has.
With the C extension installed, no CLIENT span appears for an outbound
call. Confirm php -m | grep opentelemetry actually lists the extension
inside the same environment the script runs in (a Composer-only install
does not install it) and that the call goes through GuzzleHttp\Client,
not a raw curl_exec() or file_get_contents(), neither of which
opentelemetry-auto-guzzle can hook.