Express
Add request tracing, correlated logs and metrics to an Express app.
Express
This guide assumes the Node.js SDK guide and adds Express's own request tracing on top of it. Nothing here is Express-specific configuration beyond enabling the auto-instrumentation bundle that already ships with the SDK guide's install step.
Prerequisites
- The Node.js SDK guide done, including an ingestion token.
- An Express app.
Install
Nothing beyond the SDK guide's packages, repeated here for a reader who landed on this page directly:
npm install @opentelemetry/api @opentelemetry/api-logs \
  @opentelemetry/sdk-node @opentelemetry/sdk-logs \
  @opentelemetry/auto-instrumentations-node \
  @opentelemetry/exporter-trace-otlp-proto \
  @opentelemetry/exporter-metrics-otlp-proto \
  @opentelemetry/exporter-logs-otlp-proto
@opentelemetry/auto-instrumentations-node bundles
@opentelemetry/instrumentation-express and
@opentelemetry/instrumentation-http, which is what produces request spans
automatically once the SDK is running before your app code.
Configure
Identical to the SDK guide's src/instrumentation.js, loaded the same way,
before Express is required anywhere:
{
  "scripts": {
    "start": "node --require ./src/instrumentation.js src/server.js"
  }
}
export OTEL_EXPORTER_OTLP_ENDPOINT=<UPZERO_OTLP_ENDPOINT>
export OTEL_EXPORTER_OTLP_PROTOCOL=http/protobuf
export OTEL_EXPORTER_OTLP_HEADERS="Authorization=Bearer <UPZERO_INGEST_TOKEN>"
export OTEL_SERVICE_NAME=my-express-serviceEndpoint policy
Do not disable transport verification against a real endpoint. See the guide template for the full policy.
Ordering matters
--require runs instrumentation.js before server.js, and that ordering
is what lets the instrumentation patch Express and http before your app
first requires them. Importing the SDK bootstrap from inside server.js
instead, after require('express') has already run, produces a process
that starts cleanly and never emits a request span, with no error anywhere
to say why.
Logs
Same as the SDK guide: get a logger and emit through the Logs API, or wire winston/pino if your app already has one (see that guide's Logs section).
const { logs, SeverityNumber } = require('@opentelemetry/api-logs');
const logger = logs.getLogger('my-express-service');

app.get('/work', async (req, res) => {
  logger.emit({
    severityNumber: SeverityNumber.INFO,
    severityText: 'INFO',
    body: 'work cycle complete',
  });
  res.json({ status: 'ok' });
});
Traces
No code required for the request span itself: hitting any route produces a
SERVER span named for the method and matched route
(GET /work), with http.request.method, http.route and
http.response.status_code attributes, from
@opentelemetry/instrumentation-express and @opentelemetry/instrumentation-http
alone.
Add your own child spans the same way as the SDK guide, inside a route handler:
const { trace } = require('@opentelemetry/api');
const tracer = trace.getTracer('my-express-service');

app.get('/work', async (req, res) => {
  await tracer.startActiveSpan('work-cycle', async (span) => {
    // ...
    span.end();
  });
  res.json({ status: 'ok' });
});
A database client with its own OTel instrumentation (pg, mysql2,
mongodb, and others getNodeAutoInstrumentations() bundles) produces a
CLIENT span nested under whichever span was active when the query ran,
with no code change either.
Metrics
Identical to the SDK guide: create a counter or histogram once, record from inside a route handler.
Verify
curl http://localhost:8080/work
up0 tail --type traces --since 15m
A healthy request produces a root SERVER span plus whatever you nested
under it. See Verify ingestion for the full CLI
walkthrough.
This guide was walked against
javascript/express
in up0-otel-examples (commit 5ad81ed0), run directly with node --require ./src/instrumentation.js src/server.js against a real Collector, curl
driving /work and /boom. Real, token-redacted output:
$ up0 tail --type logs --since 15m
2026-09-16T13:13:05.442000Z INFO  1643-nodejs-express-walk work cycle complete (items 11)
2026-09-16T13:13:05.517000Z INFO  1643-nodejs-express-walk work cycle complete (items 12)
2026-09-16T13:13:05.576000Z ERROR 1643-nodejs-express-walk boom: deliberate example failure

$ up0 tail --type traces --since 15m
1643-nodejs-express-walk GET / 10299791ns Unset 016f84fbc3073afcc80c0a143960fa64
1643-nodejs-express-walk GET /work 44240208ns Unset ad5713f4189c5d29ced8e2f6d142520e
1643-nodejs-express-walk GET /work 26856833ns Unset 66b3b13e101e47cfd2c715480a5bff91
1643-nodejs-express-walk GET /boom 2953000ns Error cf820c9f50de4164a3d70c7972538d02
1643-nodejs-express-walk compute-batch 35832583ns Ok ad5713f4189c5d29ced8e2f6d142520e
1643-nodejs-express-walk work-cycle 36148708ns Ok ad5713f4189c5d29ced8e2f6d142520e
1643-nodejs-express-walk boom 586125ns Error cf820c9f50de4164a3d70c7972538d02

$ up0 metrics ls --since 15m
metric_name             metric_type  series_count
work.cycle.duration      histogram    11
work.items.processed     counter      11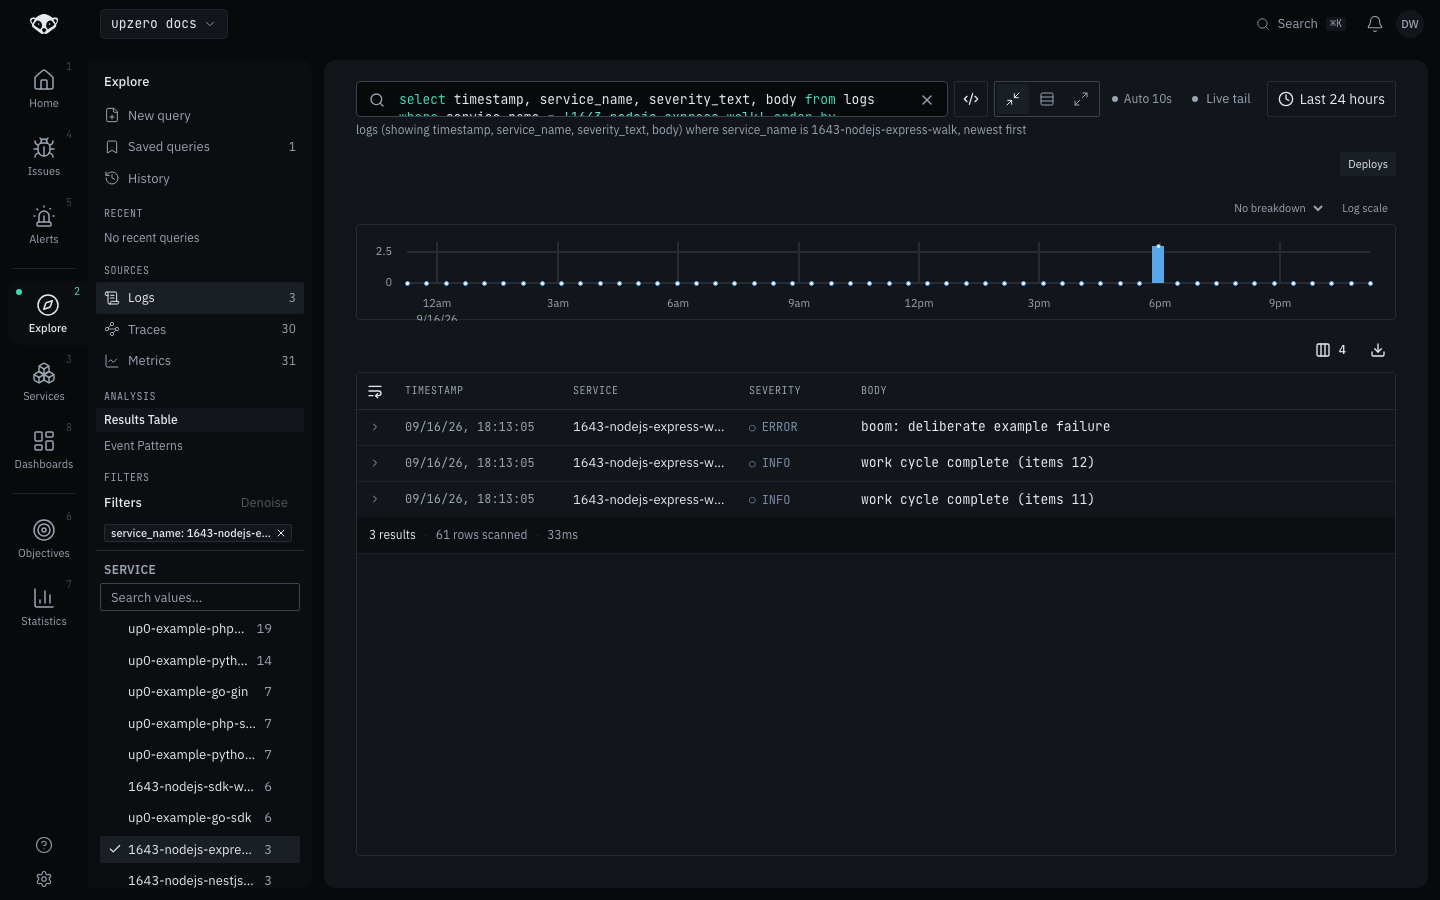
Troubleshooting
No SERVER span, and the process runs fine. This is the "instrumentation
loaded after Express" ordering trap above, not a broken install; check
package.json's start script uses --require ./src/instrumentation.js
ahead of the entry file rather than the entry file importing it.