Node.js
Send logs, traces and metrics from a plain Node.js app with the OpenTelemetry SDK, no framework assumed.
Node.js
The OpenTelemetry SDK for Node.js (@opentelemetry/sdk-node) sends OTLP
directly to upzero. There is no upzero-specific package to install, just the
OTel SDK pointed at your org's ingestion endpoint with a token attached.
This guide walks the plain SDK, no web framework. If you use Express, Next.js or NestJS, the framework-specific guides build directly on this one and add request tracing.
Prerequisites
- Node.js 20 or later.
- An ingestion token with
traces,logsandmetricsscoped.
Install
npm install @opentelemetry/api @opentelemetry/api-logs \
  @opentelemetry/sdk-node @opentelemetry/sdk-logs \
  @opentelemetry/auto-instrumentations-node \
  @opentelemetry/exporter-trace-otlp-proto \
  @opentelemetry/exporter-metrics-otlp-proto \
  @opentelemetry/exporter-logs-otlp-proto
@opentelemetry/auto-instrumentations-node bundles instrumentation for
outbound HTTP calls and dozens of other common libraries, so anything your
app calls over HTTP produces spans without further setup.
The Node SDK has to start before your application code runs, so it lives in
its own file loaded with --require, not imported from inside your app:
{
  "scripts": {
    "start": "node --require ./src/instrumentation.js src/main.js"
  }
}
Configure
const { NodeSDK } = require('@opentelemetry/sdk-node');
const { getNodeAutoInstrumentations } = require('@opentelemetry/auto-instrumentations-node');
const { OTLPTraceExporter } = require('@opentelemetry/exporter-trace-otlp-proto');
const { OTLPMetricExporter } = require('@opentelemetry/exporter-metrics-otlp-proto');
const { OTLPLogExporter } = require('@opentelemetry/exporter-logs-otlp-proto');
const { PeriodicExportingMetricReader } = require('@opentelemetry/sdk-metrics');
const { BatchLogRecordProcessor } = require('@opentelemetry/sdk-logs');

const sdk = new NodeSDK({
  traceExporter: new OTLPTraceExporter(),
  metricReaders: [
    new PeriodicExportingMetricReader({ exporter: new OTLPMetricExporter() }),
  ],
  logRecordProcessors: [
    new BatchLogRecordProcessor({ exporter: new OTLPLogExporter() }),
  ],
  instrumentations: [getNodeAutoInstrumentations()],
});

sdk.start();

module.exports = { shutdown: () => sdk.shutdown() };
All three exporters above read their target, protocol and headers from
standard OTEL_EXPORTER_OTLP_* environment variables, so nothing in this
file names an endpoint or a token:
export OTEL_EXPORTER_OTLP_ENDPOINT=<UPZERO_OTLP_ENDPOINT>
export OTEL_EXPORTER_OTLP_PROTOCOL=http/protobuf
export OTEL_EXPORTER_OTLP_HEADERS="Authorization=Bearer <UPZERO_INGEST_TOKEN>"
export OTEL_SERVICE_NAME=my-service
Both placeholders come from up0 tokens create's
output: <UPZERO_OTLP_ENDPOINT> is its Endpoint: line, <UPZERO_INGEST_TOKEN>
is the UP0_INGEST_TOKEN= value shown once at creation. See the
guide template for the endpoint policy this
site follows throughout.
Endpoint policy
Do not disable transport verification on either exporter above, whatever your SDK version calls that option. Every regional ingestion endpoint is TLS-only; that kind of option exists in OTel SDKs for a local, unencrypted Collector during development, never for a real endpoint. See the guide template for the full policy.
Logs
@opentelemetry/sdk-logs above already wires a BatchLogRecordProcessor
into the SDK. Get a logger and emit through the OTel Logs API directly, the
plainest option and the one that needs nothing beyond the packages already
installed:
const { logs, SeverityNumber } = require('@opentelemetry/api-logs');

const logger = logs.getLogger('my-service');

logger.emit({
  severityNumber: SeverityNumber.INFO,
  severityText: 'INFO',
  body: 'work cycle complete',
  attributes: { items: 12 },
});
A log emitted from inside an active span (see Traces below) is automatically
correlated: it carries that span's trace_id and span_id, which is how
Explore and up0 tail can show a log next to the trace it belongs to.
If your app already uses winston or pino, wiring the logger you already
have in is usually less work than switching to the Logs API by hand. Both
have an actively maintained OTel instrumentation package
(@opentelemetry/instrumentation-winston,
@opentelemetry/instrumentation-pino) that injects trace_id/span_id
into every log call and forwards the record to the Logs SDK, registered the
same way as the HTTP auto-instrumentation above (instrumentations: [..., new WinstonInstrumentation()]). The Next.js
and NestJS guides on this site both do
exactly this with winston; see their Configure sections for the full setup,
including a package that is easy to miss (Troubleshooting there covers it).
Traces
const { trace, SpanStatusCode } = require('@opentelemetry/api');

const tracer = trace.getTracer('my-service');

await tracer.startActiveSpan('work-cycle', async (span) => {
  try {
    // ... your code ...
    span.setStatus({ code: SpanStatusCode.OK });
  } finally {
    span.end();
  }
});
Nest spans inside each other by calling startActiveSpan again while the
outer one is active; the inner span becomes a child automatically through
OTel's active-context propagation, no explicit parent argument needed.
Outbound HTTP calls get their own CLIENT spans for free from
getNodeAutoInstrumentations(), with no code change.
Metrics
const { metrics } = require('@opentelemetry/api');

const meter = metrics.getMeter('my-service');

const itemsProcessed = meter.createCounter('work.items.processed', {
  description: 'Number of work items processed',
});
const cycleDuration = meter.createHistogram('work.cycle.duration', {
  description: 'Duration of a work cycle, in milliseconds',
  unit: 'ms',
});

itemsProcessed.add(12);
cycleDuration.record(43);
PeriodicExportingMetricReader above exports on its own schedule; nothing
further is needed to flush metrics during normal operation. A short-lived
process should call sdk.shutdown() before exiting, which flushes every
signal, not metrics alone.
Verify
Run your app, then confirm with the CLI:
up0 tail --type logs --since 15m
up0 tail --type traces --since 15m
See Verify ingestion for the full walkthrough,
including up0 ingest test and what a healthy Explore query looks like.
This guide was walked against
javascript/sdk
in up0-otel-examples (commit ea15a2e7), run directly with node --require ./src/instrumentation.js src/main.js against a real Collector. Real, token-redacted
output:
$ up0 tail --type logs --since 15m
2026-09-16T13:11:40.509000Z INFO  1643-nodejs-sdk-walk work cycle complete (iteration 1, items 11)
2026-09-16T13:11:40.521000Z INFO  1643-nodejs-sdk-walk work cycle complete (iteration 2, items 12)
2026-09-16T13:11:40.532000Z INFO  1643-nodejs-sdk-walk work cycle complete (iteration 3, items 13)
2026-09-16T13:11:40.543000Z INFO  1643-nodejs-sdk-walk work cycle complete (iteration 4, items 14)
2026-09-16T13:11:40.555000Z INFO  1643-nodejs-sdk-walk work cycle complete (iteration 5, items 15)
2026-09-16T13:11:40.556000Z ERROR 1643-nodejs-sdk-walk boom: deliberate example failure

$ up0 tail --type traces --since 15m
1643-nodejs-sdk-walk compute-batch 11463292ns Ok 81361f468ac198bf8481af1ee9c9abcf
1643-nodejs-sdk-walk work-cycle 11811291ns Ok 81361f468ac198bf8481af1ee9c9abcf
1643-nodejs-sdk-walk boom 498875ns Error 8106ff7c7723771619a543df5b3e9e6b
1643-nodejs-sdk-walk GET 55950792ns Unset 80945bb6f5b4c9775ef7d057d37806f0

$ up0 metrics ls --since 15m
metric_name             metric_type  series_count
work.cycle.duration      histogram    10
work.items.processed     counter      10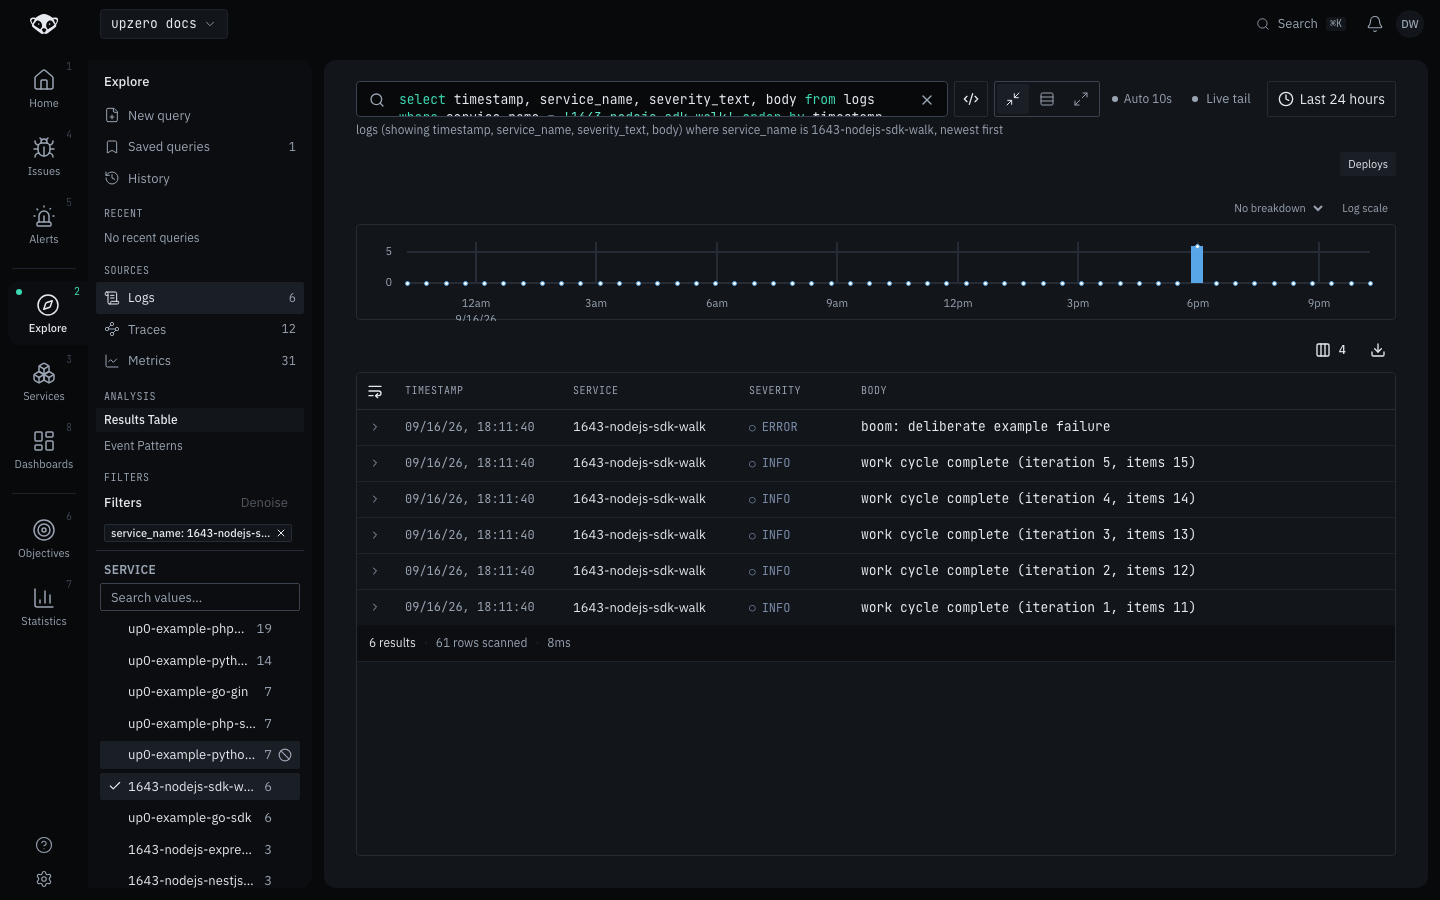
Troubleshooting
OTEL_EXPORTER_OTLP_HEADERS silently not applied. The exporters parse
this variable as key=value pairs separated by commas, with no Bearer
prefix implied; get the format wrong (for example a stray space around =)
and the exporter sends no Authorization header at all, which the Collector
rejects as an unauthenticated request rather than reporting a parse error.
Copy the value verbatim from up0 tokens create's output.
Nothing exports if the process exits before sdk.shutdown() runs. Both
the trace and log processors used above are batching processors: they hold
records in memory and flush on a timer or on shutdown(), not on every
span.end()/logger.emit() call. A script that calls process.exit()
directly, rather than letting main() return and the process exit
naturally after await shutdown(), drops whatever was still buffered.