Next.js
Send logs, traces and metrics from a Next.js App Router service with the instrumentation.ts hook.
Next.js
Next.js does not support node --require, the pattern the
Node.js SDK guide and
Express guide use to start OpenTelemetry
before application code runs. Next has its own equivalent instead: the
instrumentation.ts file at the project root (or under src/), exporting a
register() function Next calls once per server runtime it starts.
This guide covers the node runtime only. Next.js can also run a route or
middleware on the edge runtime, a separate, more restricted JavaScript
environment (no Node built-ins like http, dns, fs) used for
low-latency, globally-distributed code. @opentelemetry/sdk-node imports
those Node built-ins directly, so it cannot run on the edge runtime at all.
An app that needs edge routes instrumented needs a separate, edge-compatible
setup this guide does not build; every route here runs on the node runtime,
which is the default for both pages and Route Handlers unless a file opts
into export const runtime = 'edge'.
Prerequisites
- Next.js 15 or later, App Router.
- An ingestion token with
traces,logsandmetricsscoped. - No edge routes or middleware you need instrumented (see above).
Install
npm install @opentelemetry/api @opentelemetry/api-logs \
  @opentelemetry/sdk-node @opentelemetry/sdk-logs \
  @opentelemetry/auto-instrumentations-node \
  @opentelemetry/exporter-trace-otlp-proto \
  @opentelemetry/exporter-metrics-otlp-proto \
  @opentelemetry/exporter-logs-otlp-proto \
  @opentelemetry/instrumentation-winston \
  @opentelemetry/winston-transport winston
This guide uses winston for logs rather than the Logs API directly (the SDK guide's plain option); see Logs below for why, and see the SDK guide if you would rather emit through the Logs API instead and skip the last three packages above.
Add instrumentation.ts next to your app/ directory (inside src/ if
your app uses a src/ layout):
export async function register() {
  if (process.env.NEXT_RUNTIME === 'nodejs') {
    await import('./instrumentation.node');
  }
}
register() runs for every server runtime Next starts, node and edge alike,
even in an app with no edge routes, because Next compiles this file for both.
The NEXT_RUNTIME guard is what keeps the actual SDK bootstrap (which
imports Node built-ins) out of the edge compilation; without it, an app with
zero edge code still fails to build the moment it gains one.
Next also needs to know not to bundle the OTel and winston packages into the server build:
import type { NextConfig } from 'next';

const nextConfig: NextConfig = {
  serverExternalPackages: [
    '@opentelemetry/api',
    '@opentelemetry/api-logs',
    '@opentelemetry/auto-instrumentations-node',
    '@opentelemetry/exporter-logs-otlp-proto',
    '@opentelemetry/exporter-metrics-otlp-proto',
    '@opentelemetry/exporter-trace-otlp-proto',
    '@opentelemetry/instrumentation-winston',
    '@opentelemetry/sdk-logs',
    '@opentelemetry/sdk-metrics',
    '@opentelemetry/sdk-node',
    '@opentelemetry/winston-transport',
    'winston',
  ],
};

export default nextConfig;
serverExternalPackages is stable in Next.js 15 (it replaces the older
experimental.serverComponentsExternalPackages). Without it the bundler
pulls the OpenTelemetry packages into the server build, and the SDK the
route handlers see is not the one register() started.
Configure
import { NodeSDK } from '@opentelemetry/sdk-node';
import { getNodeAutoInstrumentations } from '@opentelemetry/auto-instrumentations-node';
import { WinstonInstrumentation } from '@opentelemetry/instrumentation-winston';
import { OTLPTraceExporter } from '@opentelemetry/exporter-trace-otlp-proto';
import { OTLPMetricExporter } from '@opentelemetry/exporter-metrics-otlp-proto';
import { OTLPLogExporter } from '@opentelemetry/exporter-logs-otlp-proto';
import { PeriodicExportingMetricReader } from '@opentelemetry/sdk-metrics';
import { BatchLogRecordProcessor } from '@opentelemetry/sdk-logs';

const sdk = new NodeSDK({
  traceExporter: new OTLPTraceExporter(),
  metricReaders: [
    new PeriodicExportingMetricReader({ exporter: new OTLPMetricExporter() }),
  ],
  logRecordProcessors: [
    new BatchLogRecordProcessor({ exporter: new OTLPLogExporter() }),
  ],
  instrumentations: [getNodeAutoInstrumentations(), new WinstonInstrumentation()],
});

sdk.start();
Same environment variables as every other Node.js guide on this site:
export OTEL_EXPORTER_OTLP_ENDPOINT=<UPZERO_OTLP_ENDPOINT>
export OTEL_EXPORTER_OTLP_PROTOCOL=http/protobuf
export OTEL_EXPORTER_OTLP_HEADERS="Authorization=Bearer <UPZERO_INGEST_TOKEN>"
export OTEL_SERVICE_NAME=my-nextjs-service
Endpoint policy
Do not disable transport verification against a real endpoint. See the guide template for the full policy.
Unlike the --require-loaded examples, there is no explicit shutdown()
call here: Next controls the server process's lifecycle, so this guide does
not add its own signal handlers around it.
Logs
This guide wires up winston rather than the Logs API directly, because that
is what most Next.js apps already have, and winston has an actively
maintained OTel instrumentation
(@opentelemetry/instrumentation-winston, in
open-telemetry/opentelemetry-js-contrib) that both injects
trace_id/span_id into every log call automatically and forwards the
record to the Logs SDK, registered above alongside the HTTP
auto-instrumentation.
import winston from 'winston';

export const logger = winston.createLogger({
  level: 'info',
  format: winston.format.json(),
  transports: [new winston.transports.Console()],
});import { logger } from '@/logger';
logger.info('work cycle complete', { items: 12 });Also install @opentelemetry/winston-transport
@opentelemetry/instrumentation-winston alone only adds trace_id/span_id
to what winston already prints to its own transports. Forwarding records
to the Logs SDK, the part that gets them to upzero, only activates when
@opentelemetry/winston-transport is also installed, and this is silent
either way: no warning, no error, traces and metrics keep working, logs
just never arrive. It is in the install command above; see Troubleshooting
if you added winston separately and skipped it.
If you would rather not add a logging library, see the SDK guide's Logs section for the plain Logs API approach; it works the same way inside a Next.js Route Handler.
Traces
A Route Handler's runtime export defaults to nodejs; this guide spells
it out because that default is exactly the fact the guide is about:
export const runtime = 'nodejs';

import { NextResponse } from 'next/server';
import { trace, metrics, SpanStatusCode } from '@opentelemetry/api';
import { logger } from '@/logger';

const tracer = trace.getTracer('my-nextjs-service');

export async function GET() {
  const items = await tracer.startActiveSpan('work-cycle', async (span) => {
    const count = await computeBatch();
    span.setStatus({ code: SpanStatusCode.OK });
    span.end();
    return count;
  });
  return NextResponse.json({ status: 'ok', items });
}
Next's own request handling produces the root SERVER span automatically,
named for the resolved route file (GET /api/work/route, not GET /api/work;
see Troubleshooting). Everything nested under startActiveSpan becomes a
child of it the same way as every other guide on this site.
Metrics
Identical to the SDK guide: create a counter or histogram once at module scope (not inside the route handler, so it is not recreated on every request), record from inside the handler.
Verify
curl http://localhost:3000/api/work
up0 tail --type logs --since 15m
up0 tail --type traces --since 15m
See Verify ingestion for the full CLI walkthrough and what a healthy Explore query looks like.
This guide was walked against javascript/nextjs in up0-otel-examples,
built with this task (commit 19fa618 on branch docs/1643-nodejs, not yet
pushed), run with next build && next start against a real Collector,
curl driving /api/work and /api/boom. Real, token-redacted output:
$ up0 tail --type logs --since 15m
2026-09-16T13:18:14.882000Z info  1643-nodejs-nextjs-walk2 work cycle complete
2026-09-16T13:18:14.913000Z info  1643-nodejs-nextjs-walk2 work cycle complete
2026-09-16T13:18:14.927000Z error 1643-nodejs-nextjs-walk2 boom: deliberate example failure

$ up0 tail --type traces --since 15m
1643-nodejs-nextjs-walk2 GET /api/work/route 29959417ns Unset c33d58b9a2500733d3404d641e3c74de
1643-nodejs-nextjs-walk2 GET /api/boom/route 2342583ns Error deae7434d21345907e847ae43151653b
1643-nodejs-nextjs-walk2 compute-batch 12212875ns Ok a19883bdcba56eff4621b45816fe1936
1643-nodejs-nextjs-walk2 work-cycle 12285708ns Ok a19883bdcba56eff4621b45816fe1936
1643-nodejs-nextjs-walk2 boom 366333ns Error deae7434d21345907e847ae43151653b

$ up0 metrics ls --since 15m
metric_name             metric_type  series_count
work.cycle.duration      histogram    12
work.items.processed     counter      12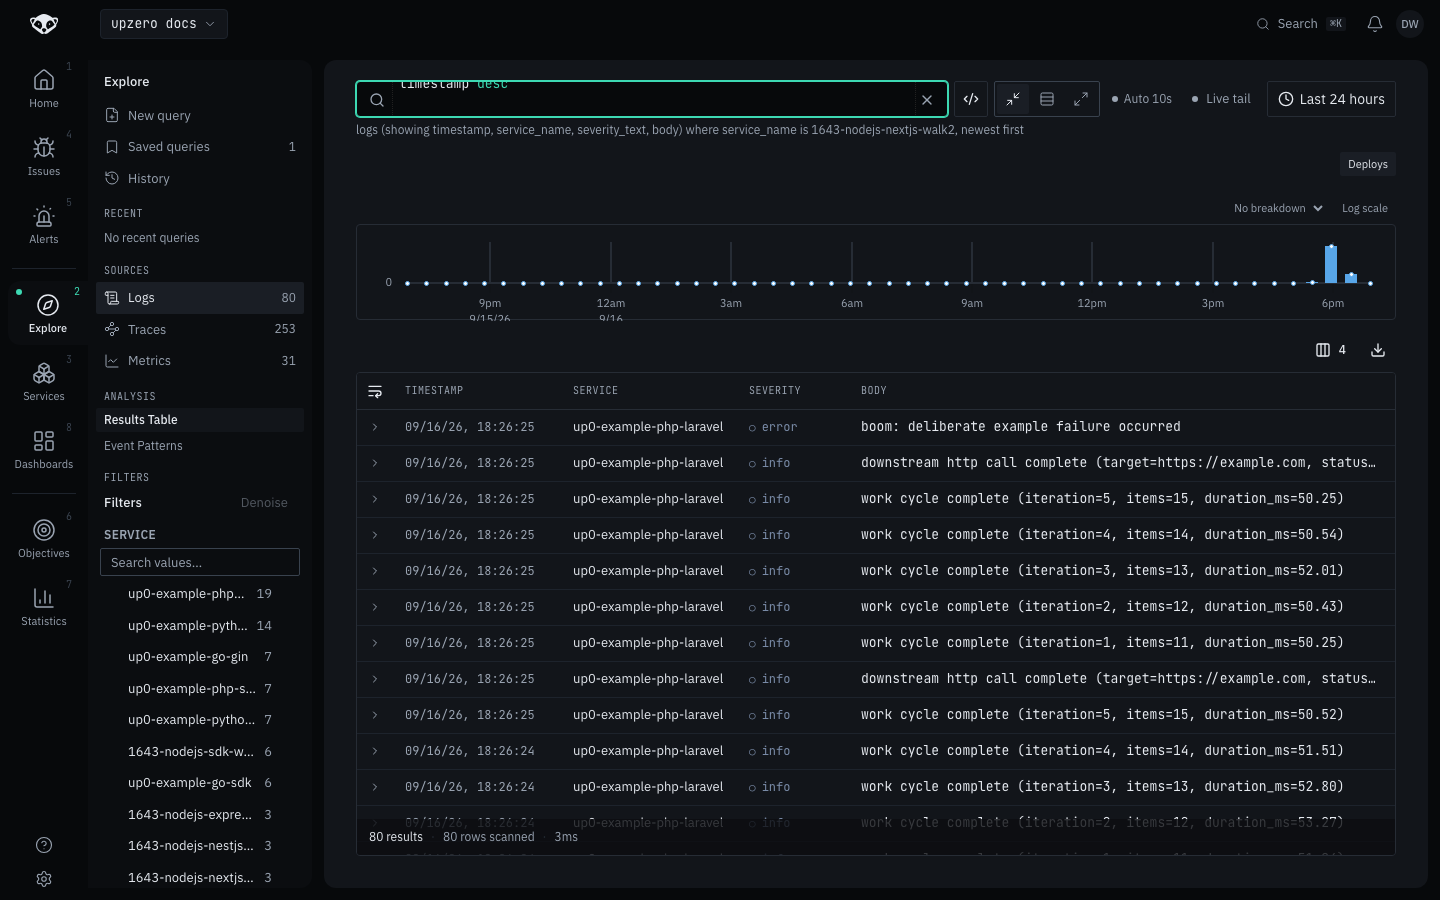
Edge runtime
Out of scope for this guide. instrumentation.node.ts imports http,
dns and other Node built-ins that the edge runtime does not provide, so it
cannot be the same file used on both runtimes. An app that needs edge routes
instrumented needs a separate, edge-compatible OTel setup this guide does
not build. Keep the guard even in an app with no edge code: Next compiles
instrumentation.ts for every runtime it will start, so the first edge
route or middleware added later would try to bundle Node built-ins into the
edge build. That failure was not walked here; the sample has no edge code.
Troubleshooting
Logs never arrive; traces and metrics do. The missing
@opentelemetry/winston-transport package covered in Logs above. Nothing
errors either way, which is what makes this one worth checking first:
confirm the package is in package.json, not just
@opentelemetry/instrumentation-winston.
Severity text is lowercase here, uppercase in the other Node guides. The
SDK and Express
guides call the Logs API directly with severityText: 'INFO'/'ERROR'
(uppercase, chosen by that code). Winston's own level names are lowercase
(info, error), and the instrumentation forwards the level as-is rather
than upcasing it. Both are valid OTel severity text; this is not a bug in
either guide, just a difference in what each one's logging path chose to
call the level.
The root span is named GET /api/work/route, not GET /api/work. Next's
own request-handling instrumentation includes the resolved route file in the
span name. This is a naming detail worth knowing before matching a span by
name rather than by kind, not a defect.