PHP + Laravel
Add request-level tracing to a Laravel app on top of the PHP SDK guide.
PHP + Laravel
This guide assumes the PHP SDK guide and adds
open-telemetry/opentelemetry-auto-laravel, which auto-instruments a
Laravel app's request lifecycle: one SERVER span per request, a CLIENT span
for outbound calls made through Laravel's Http facade, and a log watcher
that correlates every Log:: call to whichever span is active. The walked,
working reference is the
php/laravel
sample in up0-otel-examples.
Laravel shares PHP's request-per-process concern (see the SDK guide's
introduction), sharpened by one extra step: every incoming request re-runs
vendor/autoload.php from scratch, re-registering every OTel provider, and
if the request ends without an explicit flush, whatever that request's
exporters were still batching is gone. This guide's Configure section covers
where that flush goes in a Laravel app specifically.
Prerequisites
- Everything in the PHP SDK guide's
prerequisites, but PHP 8.3 or later (Laravel 13's floor) and the
opentelemetryPECL extension is required, not optional. Unlike the bare SDK guide, there is no Composer path that skips it: see "The extension is required here" below.
Install
composer require laravel/framework open-telemetry/api open-telemetry/sdk \
  open-telemetry/exporter-otlp open-telemetry/sem-conv \
  open-telemetry/opentelemetry-auto-laravel
The extension is required here. The PHP SDK guide
has a Composer path that skips ext-opentelemetry entirely, falling back to
hand-written spans. Laravel does not have an equivalent fallback in this
guide, because opentelemetry-auto-laravel's hooks (into
Illuminate\Contracts\Http\Kernel::handle() for the request span, and into
Illuminate\Http\Client's events for the outbound CLIENT span) are
zend_observer hooks the extension itself provides. There is no
pure-Composer way to get either one.
If you genuinely cannot install the extension (a hosting environment
that does not allow custom PECL extensions, for instance), the fallback is
to skip opentelemetry-auto-laravel and write the request span by hand in
middleware: start a span in a before hook reading the incoming request's
propagated trace context, end it in a terminate hook, and use the SDK
guide's manual-span pattern for anything else you want traced. That path is
not covered by this guide or by the sample, because the sample's whole
premise is what opentelemetry-auto-laravel gives you for free; write it
the way the Go SDK guide writes spans by
hand if you need it.
The sample's Dockerfile installs the extension with
docker-php-extension-installer:
RUN chmod +x /usr/local/bin/install-php-extensions \
    && install-php-extensions opentelemetry
Configure
Same environment variables as the PHP SDK guide.
The one Laravel-specific piece is where the flush happens: not at the bottom
of a script, but in a service provider's terminating() callback, which
Laravel calls after the response has been sent and before the request's
execution truly ends:
// app/Providers/AppServiceProvider.php
public function boot(): void
{
    $this->app->terminating(function () {
        foreach ([Globals::tracerProvider(), Globals::meterProvider(), Globals::loggerProvider()] as $provider) {
            if (method_exists($provider, 'forceFlush')) {
                $provider->forceFlush();
            }
            if (method_exists($provider, 'shutdown')) {
                $provider->shutdown();
            }
        }
    });
}
Skip this and a request that ends in an exception is exactly where a drop is easiest to miss: the response still renders correctly, and the only sign anything is wrong is that the request's telemetry never arrives.
Never these two things
No real endpoint host outside the token-create output. No
OTEL_EXPORTER_OTLP_INSECURE=true against <UPZERO_OTLP_ENDPOINT>.
Logs
Call Laravel's own Log:: facade. No trace-context wiring is needed:
opentelemetry-auto-laravel's LogWatcher listens for
Illuminate\Log\Events\MessageLogged and emits it as an OTel log record
correlated to whatever span is active.
use Illuminate\Support\Facades\Log;

Log::info(sprintf(
    'work cycle complete (iteration=%d, items=%d, duration_ms=%.2f)',
    $iteration, $items, $durationMs,
));
For an error, pass the exception under the exception context key:
Log::error('boom: deliberate example failure occurred', ['exception' => $exception]);This can double-record the exception
The sample's boom route also calls $span->recordException($exception)
explicitly, for clarity. opentelemetry-auto-laravel's ExceptionWatcher
reacts to the same Log::error() call independently (it watches the
identical MessageLogged event) and records a second exception span
event of its own onto whatever span is active. Verified against a live
run: the span's events come back ['exception', 'exception'], not one.
Both recordings are genuine and correct; this is what combining explicit
instrumentation with Laravel's own exception watcher actually produces,
not a bug to fix by removing either one.
Traces
No span code for the request itself: opentelemetry-auto-laravel hooks
Illuminate\Contracts\Http\Kernel::handle() and produces a SERVER span per
request automatically, carrying http.request.method, http.route and
http.response.status_code once the route has resolved and the response
exists.
For your own work inside a request, start spans the same way the SDK guide does:
$span = $tracer->spanBuilder('work-cycle')
    ->setSpanKind(SpanKind::KIND_INTERNAL)
    ->startSpan();
$scope = $span->activate();
try {
    // ...
    $span->setStatus(StatusCode::STATUS_OK);
} finally {
    $scope->detach();
    $span->end();
}
For an outbound call, use Laravel's Http facade rather than a raw Guzzle
client. opentelemetry-auto-laravel's ClientRequestWatcher listens for
Illuminate\Http\Client's RequestSending/ResponseReceived events and
produces the CLIENT span with no span code of your own:
use Illuminate\Support\Facades\Http;

$response = Http::timeout(5)->get($target);
Metrics
Identical to the SDK guide: create instruments from the meter once (in a controller, that means once per request, since Laravel builds the controller fresh each time) and record into them.
$itemsProcessedCounter = $meter->createCounter('work.items.processed', unit: '1');
$cycleDurationHistogram = $meter->createHistogram('work.cycle.duration', unit: 'ms');

$itemsProcessedCounter->add($items, ['cycle.iteration' => $iteration]);
$cycleDurationHistogram->record($durationMs, ['cycle.iteration' => $iteration]);
Verify
The sample was walked with the extension installed, the path
opentelemetry-auto-laravel requires (see "The extension is required here"
above):
cd php/laravel
composer install
export OTEL_PHP_AUTOLOAD_ENABLED=true
export OTEL_SERVICE_NAME=up0-example-php-laravel
export OTEL_TRACES_EXPORTER=otlp
export OTEL_METRICS_EXPORTER=otlp
export OTEL_LOGS_EXPORTER=otlp
export OTEL_EXPORTER_OTLP_PROTOCOL=http/protobuf
export OTEL_EXPORTER_OTLP_ENDPOINT=<UPZERO_OTLP_ENDPOINT>
export OTEL_EXPORTER_OTLP_HEADERS="Authorization=Bearer <UPZERO_INGEST_TOKEN>"
php artisan serve --host=0.0.0.0 --port=8000
curl http://localhost:8000/api/work
curl http://localhost:8000/api/boom$ up0 tail --type logs --since 15m --service up0-example-php-laravel
2026-09-16T13:26:23.793870Z info up0-example-php-laravel work cycle complete (iteration=1, items=11, duration_ms=53.91)
2026-09-16T13:26:24.254118Z info up0-example-php-laravel downstream http call complete (target=https://example.com, status=200)
2026-09-16T13:26:25.646493Z error up0-example-php-laravel boom: deliberate example failure occurred
$ up0 tail --type traces --since 15m --service up0-example-php-laravel
up0-example-php-laravel work-cycle 51880916ns Ok f808ca02983d383fa3a3f1bea55db783
up0-example-php-laravel GET /api/work 337152334ns Unset f808ca02983d383fa3a3f1bea55db783
up0-example-php-laravel boom 1039083ns Error b27563ee351aa3067c545d2285f64a95
up0-example-php-laravel GET /api/boom 4138041ns Error b27563ee351aa3067c545d2285f64a95GET /api/work and GET /api/boom are the auto-instrumented request SERVER
spans; work-cycle and boom are the hand-written ones nested inside them.
up0 metrics ls shows work.items.processed and work.cycle.duration.
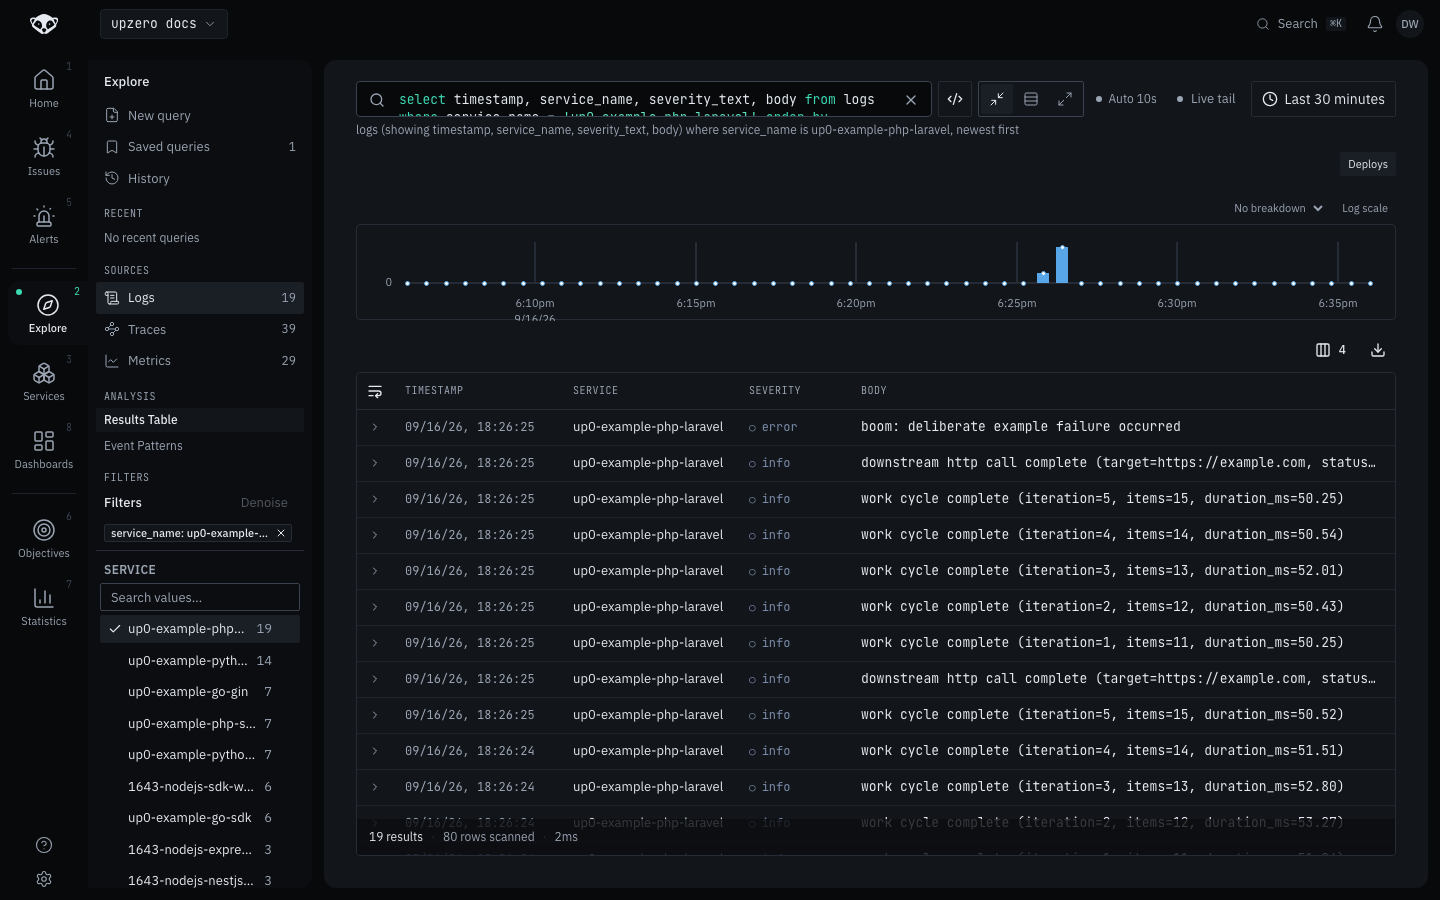
In Explore, a logs query filtered to service_name = up0-example-php-laravel
shows the correlated records across several /api/work requests and one
/api/boom request:
Troubleshooting
A request's telemetry never arrives, but the response looks fine. The
terminating() flush in Configure was not registered, or was registered in
a service provider that never boots for this request path (an API-only
route hitting a provider gated on a different middleware group, for
instance). Confirm AppServiceProvider::boot() runs for every route you
care about.
cURL error 60: SSL certificate problem: unable to get local issuer certificate. Same as the SDK guide: this only happened against a local kind cluster whose certificate chains to a locally trusted root PHP's container did not have in its CA bundle. A real upzero endpoint's certificate chains to a public root, so this does not happen in a real deployment.
boom's span shows two exception events, not one. Expected, not a
bug. See the callout under Logs above.