Python + FastAPI
Send logs, traces and metrics to upzero from a FastAPI service.
Python + FastAPI
This guide adds FastAPI's request instrumentation on top of the
Python SDK guide, which it assumes. Every
step below was run against python/fastapi in
up0-otel-examples, a
FastAPI service with a route that logs, a route that produces a parent and
child span, and a route that fails on purpose.
Prerequisites
- Python 3.9 or newer, pip or uv.
- Read the Python SDK guide first, in particular its Logs section, before continuing here.
- An ingestion token already created.
Install
pip install fastapi uvicorn \
  opentelemetry-distro opentelemetry-exporter-otlp-proto-http \
  opentelemetry-instrumentation-fastapi opentelemetry-instrumentation-logging
Configure
Same environment variables as the SDK guide, run your app under
opentelemetry-instrument instead of plain python:
export OTEL_EXPORTER_OTLP_ENDPOINT=<UPZERO_OTLP_ENDPOINT>
export OTEL_EXPORTER_OTLP_PROTOCOL=http/protobuf
export OTEL_EXPORTER_OTLP_HEADERS="Authorization=Bearer <UPZERO_INGEST_TOKEN>"
export OTEL_SERVICE_NAME=my-fastapi-service
export OTEL_RESOURCE_ATTRIBUTES=service.version=1.0.0,deployment.environment=production
export OTEL_TRACES_EXPORTER=otlp
export OTEL_METRICS_EXPORTER=otlp
export OTEL_LOGS_EXPORTER=otlp
export OTEL_PYTHON_LOGGING_AUTO_INSTRUMENTATION_ENABLED=true

opentelemetry-instrument uvicorn src.main:app --host 0.0.0.0 --port 8080
opentelemetry-instrumentation-fastapi needs no call in your code: its
instrument() function is registered as an entry point, and
opentelemetry-instrument calls it for every installed instrumentation
package before uvicorn imports your FastAPI() app. Every request gets a
SERVER span with no decorator or middleware you write yourself.
Logs
Exactly the SDK guide's Logs section: set
OTEL_PYTHON_LOGGING_AUTO_INSTRUMENTATION_ENABLED=true, raise the root
logger's level past its WARNING default, and log inside a route:
import logging

logging.getLogger().setLevel(logging.INFO)
logger = logging.getLogger("my-fastapi-service")

@app.get("/logs")
def logs_endpoint():
    logger.info("logs endpoint called")
    return {"status": "ok"}
Traces
The FastAPI auto-instrumentation's SERVER span wraps the whole request. Add your own spans inside a route the same way as the SDK guide:
from opentelemetry import trace
from opentelemetry.trace import Status, StatusCode

tracer = trace.get_tracer("my-fastapi-service")

@app.get("/work")
def work_endpoint():
    with tracer.start_as_current_span("work-cycle") as span:
        with tracer.start_as_current_span("compute-batch") as child:
            child.set_attribute("batch.items", 11)
            child.set_status(Status(StatusCode.OK))
        span.set_status(Status(StatusCode.OK))
    return {"items": 11}
Extra spans from the ASGI layer
The FastAPI/Starlette instrumentation also emits one short "http send" span per response event under each request's SERVER span. That is the ASGI instrumentation instrumenting its own transport layer, not application code; seeing two or three of them per request in a trace waterfall is expected.
Metrics
from opentelemetry import metrics

meter = metrics.get_meter("my-fastapi-service")
items_counter = meter.create_counter(name="work.items.processed", unit="1")
duration_histogram = meter.create_histogram(name="work.cycle.duration", unit="ms")

items_counter.add(11, {"route": "/work"})
duration_histogram.record(59.1, {"route": "/work"})
Verify
Start the server, drive traffic against it, then confirm the data arrived.
Unlike the SDK guide, a FastAPI service does
not need an explicit flush call: uvicorn's graceful shutdown on a single
Ctrl-C runs the OTel SDK's default atexit hook, which flushes all three
providers before the process exits, confirmed by stopping a running example
this way and finding every span, log and metric it had just sent.
curl http://localhost:8080/logs
curl http://localhost:8080/work
curl http://localhost:8080/boom
# Ctrl-C once to stop, then:
up0 tail --type logs --since 15m
up0 tail --type traces --since 15m
Real output from a run of python/fastapi against a live stack (token
redacted, already consumed by the process):
$ up0 tail --type logs --since 15m
2026-09-16T13:14:44.906648Z INFO  up0-example-python-fastapi logs endpoint called
2026-09-16T13:14:44.978944Z INFO  up0-example-python-fastapi work cycle complete (items=11, duration_ms=59.13)
2026-09-16T13:14:44.993106Z ERROR up0-example-python-fastapi boom: deliberate example failure occurred

$ up0 tail --type traces --since 15m
up0-example-python-fastapi GET /logs 11069000ns Unset 3fd465a112692ec67fe2202ae3f188f9
up0-example-python-fastapi GET /work 59987000ns Unset 54f9becc7954ee334cab2bd133e5440e
up0-example-python-fastapi compute-batch 59060000ns Ok 54f9becc7954ee334cab2bd133e5440e
up0-example-python-fastapi work-cycle 59235000ns Ok 54f9becc7954ee334cab2bd133e5440e
up0-example-python-fastapi GET /boom 882000ns Error ffa16c0bd153c09b5214ee475833043c
up0-example-python-fastapi boom 426000ns Error ffa16c0bd153c09b5214ee475833043c
work.items.processed over the same window
(up0 metrics query --metric-name work.items.processed --since 15m --aggregation sum):
2026-09-16T13:14:42Z 2026-09-16T13:15:00Z 11.0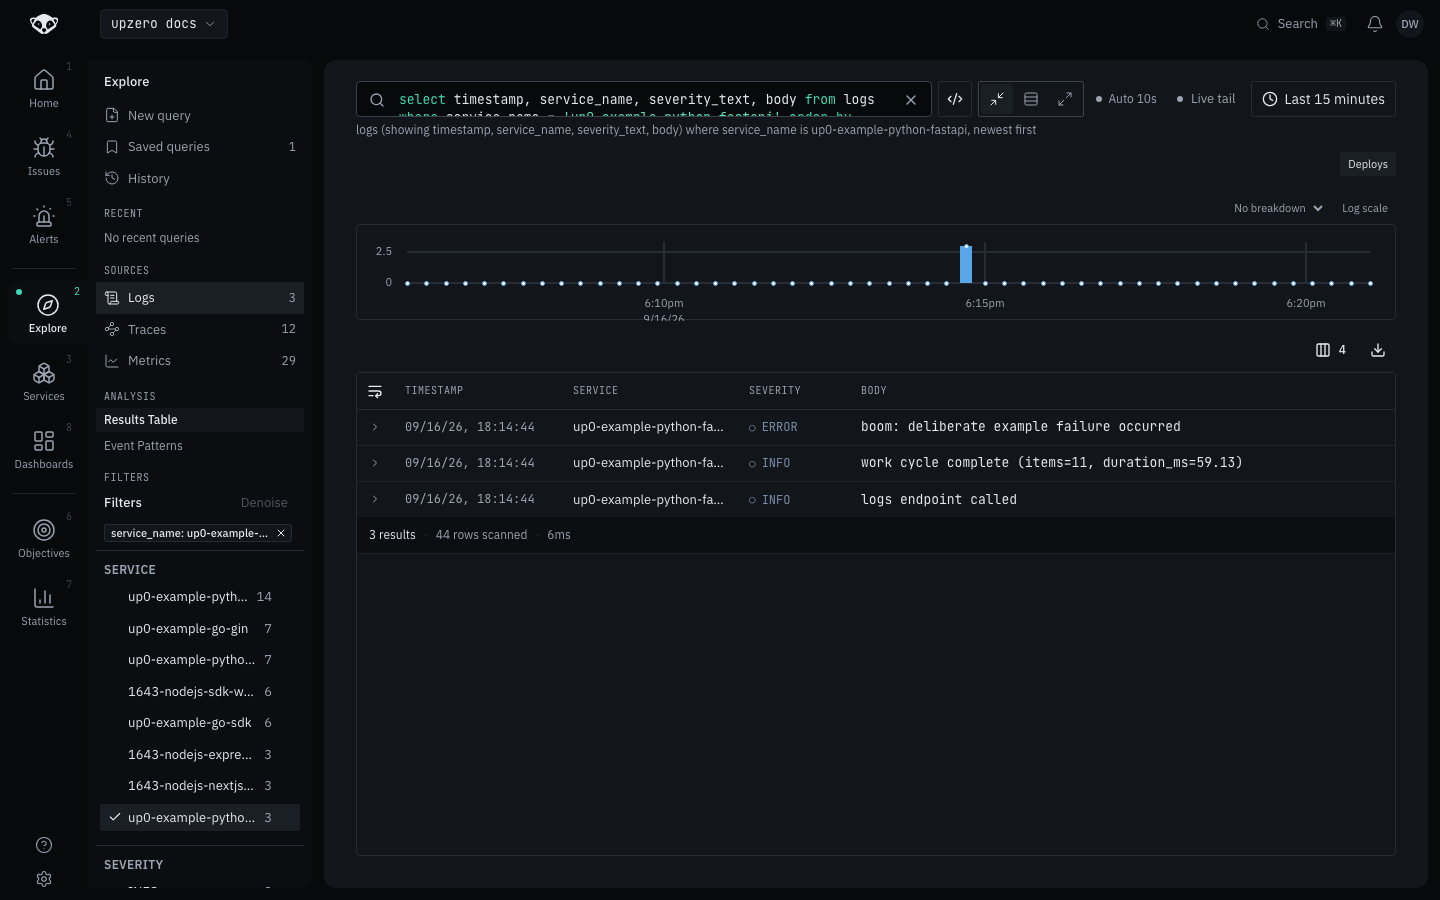
Troubleshooting
No logs arrive even though traces and metrics do.
Same cause as the SDK guide: OTEL_PYTHON_LOGGING_AUTO_INSTRUMENTATION_ENABLED=true
was missing. Confirmed the same way here, running the example with that
variable unset: up0 tail --type logs reported no logs for the run's
window while traces kept landing normally.
Logs arrive, but only ERROR ones.
The root logger's default WARNING level, same as the SDK guide. Raise it
explicitly before logging at INFO.