Python + Django
Send logs, traces and metrics to upzero from a Django service.
Python + Django
This guide adds Django's request instrumentation on top of the
Python SDK guide, which it assumes. Every
step below was run against python/django in
up0-otel-examples, a
Django project with a view that logs, a view that produces a parent and
child span, and a view that fails on purpose.
Prerequisites
- Python 3.10 or newer (Django 5.1's floor), pip or uv.
- Read the Python SDK guide first, in particular its Logs section, before continuing here.
- An ingestion token already created.
Install
pip install django \
  opentelemetry-distro opentelemetry-exporter-otlp-proto-http \
  opentelemetry-instrumentation-django opentelemetry-instrumentation-logging
Configure
Same environment variables as the SDK guide, plus one Django-specific one,
and run manage.py under opentelemetry-instrument:
export OTEL_EXPORTER_OTLP_ENDPOINT=<UPZERO_OTLP_ENDPOINT>
export OTEL_EXPORTER_OTLP_PROTOCOL=http/protobuf
export OTEL_EXPORTER_OTLP_HEADERS="Authorization=Bearer <UPZERO_INGEST_TOKEN>"
export OTEL_SERVICE_NAME=my-django-service
export OTEL_RESOURCE_ATTRIBUTES=service.version=1.0.0,deployment.environment=production
export OTEL_TRACES_EXPORTER=otlp
export OTEL_METRICS_EXPORTER=otlp
export OTEL_LOGS_EXPORTER=otlp
export OTEL_PYTHON_LOGGING_AUTO_INSTRUMENTATION_ENABLED=true
export DJANGO_SETTINGS_MODULE=myproject.settings

opentelemetry-instrument python manage.py runserver 0.0.0.0:8080 --noreload
DJANGO_SETTINGS_MODULE must already be in the environment
manage.py itself sets a default for DJANGO_SETTINGS_MODULE via
os.environ.setdefault(...), but that line runs too late:
opentelemetry-instrumentation-django reads Django's settings while
instrumenting, which happens before manage.py's own code gets a chance
to run. Confirmed by omitting the export above and running the command
otherwise unchanged: Django configured itself with bare defaults
(DEBUG=False, empty ALLOWED_HOSTS) and refused to start with
CommandError: You must set settings.ALLOWED_HOSTS if DEBUG is False.
Exporting DJANGO_SETTINGS_MODULE yourself, naming the same module
manage.py would have defaulted to, fixes it.
Logs
Exactly the SDK guide's Logs section: set
OTEL_PYTHON_LOGGING_AUTO_INSTRUMENTATION_ENABLED=true, raise the root
logger's level past its WARNING default, and log inside a view:
import logging

logging.getLogger().setLevel(logging.INFO)
logger = logging.getLogger("my-django-service")

def logs_view(request):
    logger.info("logs endpoint called")
    return JsonResponse({"status": "ok"})
Traces
The Django auto-instrumentation's SERVER span wraps the whole request. Add your own spans inside a view the same way as the SDK guide:
from opentelemetry import trace
from opentelemetry.trace import Status, StatusCode

tracer = trace.get_tracer("my-django-service")

def work_view(request):
    with tracer.start_as_current_span("work-cycle") as span:
        with tracer.start_as_current_span("compute-batch") as child:
            child.set_attribute("batch.items", 11)
            child.set_status(Status(StatusCode.OK))
        span.set_status(Status(StatusCode.OK))
    return JsonResponse({"items": 11})
Metrics
from opentelemetry import metrics

meter = metrics.get_meter("my-django-service")
items_counter = meter.create_counter(name="work.items.processed", unit="1")
duration_histogram = meter.create_histogram(name="work.cycle.duration", unit="ms")

items_counter.add(11, {"route": "/work"})
duration_histogram.record(53.2, {"route": "/work"})
Verify
Start the server, drive traffic against it, then confirm the data arrived.
curl http://localhost:8080/logs
curl http://localhost:8080/work
curl http://localhost:8080/boom
up0 tail --type logs --since 15m
up0 tail --type traces --since 15m
Real output from a run of python/django against a live stack (token
redacted, already consumed by the process):
$ up0 tail --type logs --since 15m
2026-09-16T13:17:02.152202Z INFO  up0-example-python-django logs endpoint called
2026-09-16T13:17:02.219512Z INFO  up0-example-python-django work cycle complete (items=11, duration_ms=53.18)
2026-09-16T13:17:02.233961Z ERROR up0-example-python-django boom: deliberate example failure occurred

$ up0 tail --type traces --since 15m
up0-example-python-django GET logs 557000ns Unset cdccc18cfd0029c4cc1e3e477808679f
up0-example-python-django GET work 53608000ns Unset 0ab7e727c4b479df2328390b90522835
up0-example-python-django compute-batch 53117000ns Ok 0ab7e727c4b479df2328390b90522835
up0-example-python-django work-cycle 53290000ns Ok 0ab7e727c4b479df2328390b90522835
up0-example-python-django GET boom 633000ns Error 25314680cf88998b99cbd275c7e2eb2a
up0-example-python-django boom 428000ns Error 25314680cf88998b99cbd275c7e2eb2a
work.items.processed over a run that kept the dev server up for one
metrics export interval
(up0 metrics query --metric-name work.items.processed --since 5m --aggregation sum):
2026-09-16T13:19:00Z 2026-09-16T13:19:06Z 11.0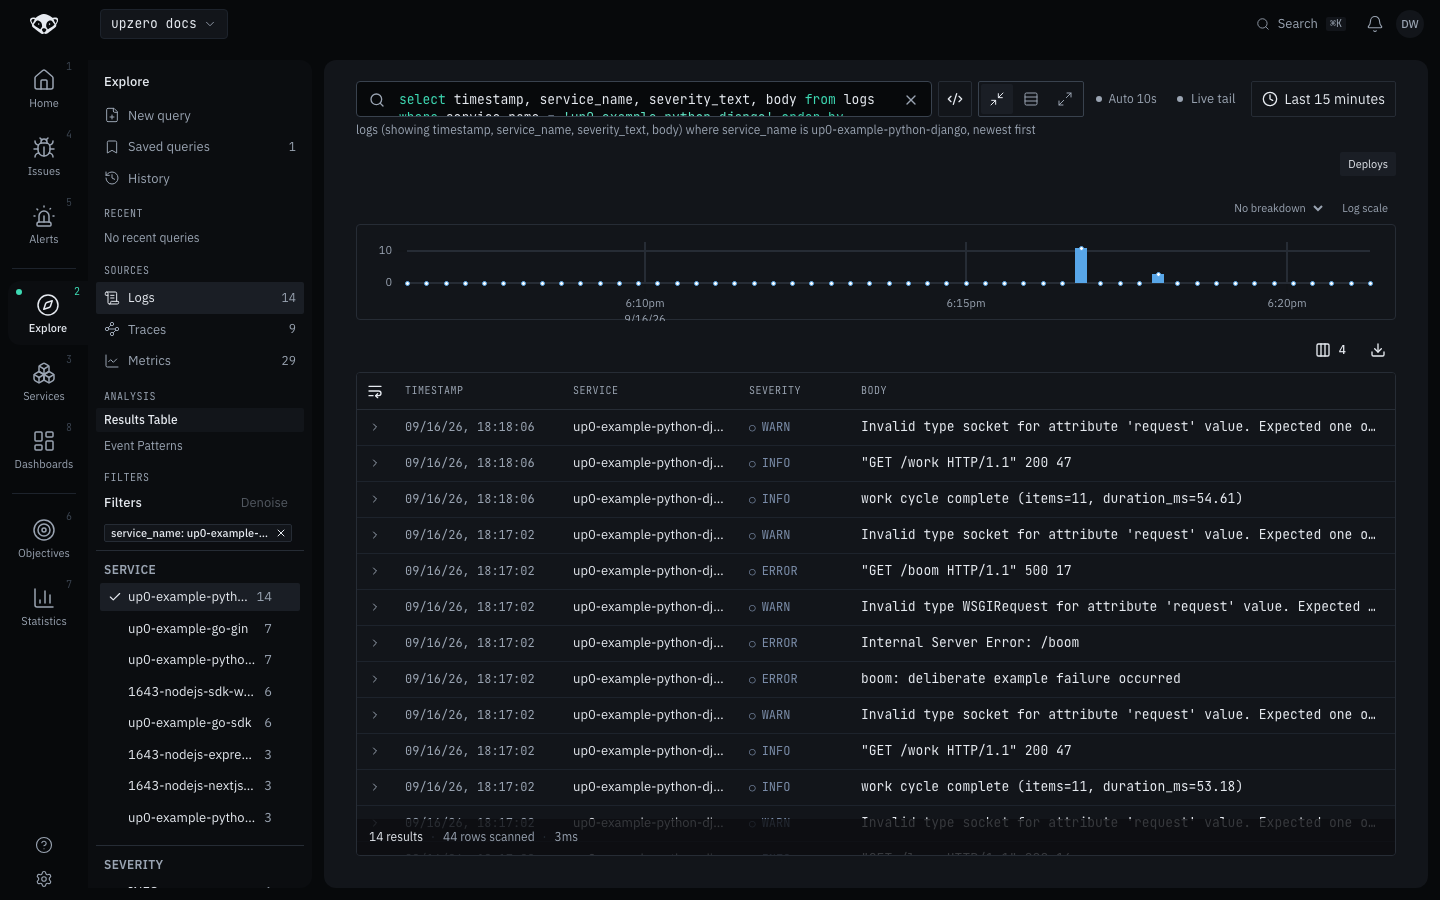
Troubleshooting
CommandError: You must set settings.ALLOWED_HOSTS if DEBUG is False on startup.
DJANGO_SETTINGS_MODULE was not set in the shell environment before
opentelemetry-instrument ran. See the callout in Configure above; this was
confirmed by reproduction, not assumed.
Metrics never show up, but logs and traces do.
Confirmed by stopping manage.py runserver (both SIGINT and SIGTERM)
immediately after driving traffic: the metric a request had just recorded
never appeared, while its log and trace landed normally. The same metric
did appear about a minute later when the server was left running instead of
stopped, matching the metrics reader's default 60-second periodic export.
Unlike the FastAPI guide, stopping
Django's development server here did not flush pending metrics. Leave the
server running for at least one export interval before relying on a metric
appearing, or lower OTEL_METRIC_EXPORT_INTERVAL (milliseconds) during
development.
A WARN log line appears for every request Django's own request logger
writes (Invalid type socket for attribute 'request' value. Expected one of ['bool', 'str', 'bytes', 'int', 'float'] or a sequence of those types).
This comes from Django's django.server logger passing a non-primitive
object (a WSGIRequest or the raw socket) as a log record's extra, which
the OTel logging bridge cannot encode as an attribute. It exports the
correlated log record correctly regardless; the warning is noise from an
attribute the bridge dropped, not a sign anything failed.