Python
Send logs, traces and metrics to upzero from a plain Python program using the OpenTelemetry SDK.
Python
This guide wires the OpenTelemetry Python SDK to upzero directly, with no framework involved. It is what the FastAPI and Django guides build on, and it is also the guide to use if your framework has no guide of its own here: any Python process that can install a package and set environment variables can send data this way.
Every step below was run against python/sdk in
up0-otel-examples, a
short-lived program that runs a five-iteration work loop, one deliberate
error, and one outbound HTTP call, then exits.
Prerequisites
- Python 3.9 or newer.
- pip or uv.
- An ingestion token already created.
Install
The OTel Python distribution bundles the API, SDK, and the auto-instrumentation
runner (opentelemetry-instrument) that patches supported libraries at process
start. Add the OTLP/HTTP exporter and the logging-instrumentation package
alongside it.
pip install opentelemetry-distro opentelemetry-exporter-otlp-proto-http \
  opentelemetry-instrumentation-logging
If your program makes outbound HTTP calls with requests, also install
opentelemetry-instrumentation-requests so those calls get their own CLIENT
span with no code change.
setuptools on a slim base image
opentelemetry-instrument's entry-point discovery imports pkg_resources
at run time. python:3.12-slim and newer minor images ship without
setuptools, and pkg_resources was removed from setuptools 81. Pin
setuptools<81 in your requirements if you hit
ModuleNotFoundError: No module named 'pkg_resources'.
Configure
Every exporter, plus the resource attributes that identify your service, is
read from standard OTEL_* environment variables. Nothing below is
upzero-specific beyond the endpoint and the token header.
export OTEL_EXPORTER_OTLP_ENDPOINT=<UPZERO_OTLP_ENDPOINT>
export OTEL_EXPORTER_OTLP_PROTOCOL=http/protobuf
export OTEL_EXPORTER_OTLP_HEADERS="Authorization=Bearer <UPZERO_INGEST_TOKEN>"
export OTEL_SERVICE_NAME=my-python-service
export OTEL_RESOURCE_ATTRIBUTES=service.version=1.0.0,deployment.environment=production
export OTEL_TRACES_EXPORTER=otlp
export OTEL_METRICS_EXPORTER=otlp
export OTEL_LOGS_EXPORTER=otlp
<UPZERO_OTLP_ENDPOINT> and <UPZERO_INGEST_TOKEN> both come from the
output of up0 tokens create (see Ingestion tokens).
Run your program under opentelemetry-instrument so it picks up these
variables and patches every installed instrumentation package before your
code runs:
opentelemetry-instrument python your_app.pyLogs
Bridging Python's standard logging module into OTel needs two things, and
both are easy to skip:
export OTEL_PYTHON_LOGGING_AUTO_INSTRUMENTATION_ENABLED=trueimport logging
# The root logger defaults to WARNING, which silently drops INFO
# records before they ever reach the OTel logging handler.
logging.getLogger().setLevel(logging.INFO)
logger = logging.getLogger("my-service")
logger.info("something happened")A log emitted inside an active span (inside a with tracer.start_as_current_span(...):
block) is automatically correlated: the exported record carries that span's
trace_id and span_id, with no extra code.
Traces
from opentelemetry import trace
from opentelemetry.trace import Status, StatusCode

tracer = trace.get_tracer("my-service")

with tracer.start_as_current_span("work-cycle") as span:
    with tracer.start_as_current_span("compute-batch") as child:
        child.set_attribute("batch.items", 12)
        child.set_status(Status(StatusCode.OK))
    span.set_status(Status(StatusCode.OK))
Nesting one start_as_current_span inside another produces a parent/child
span pair automatically, because each call activates the new span as the
current context for anything started underneath it. For an error path,
record the exception on the span and set its status explicitly:
try:
    raise RuntimeError("boom")
except RuntimeError as exc:
    span.record_exception(exc)
    span.set_status(Status(StatusCode.ERROR, str(exc)))
If you also install opentelemetry-instrumentation-requests, an outbound
requests.get(...) call produces its own CLIENT span with no code above it.
Metrics
from opentelemetry import metrics

meter = metrics.get_meter("my-service")

items_counter = meter.create_counter(
    name="work.items.processed", unit="1",
    description="Items processed per work cycle",
)
duration_histogram = meter.create_histogram(
    name="work.cycle.duration", unit="ms",
    description="Duration of a work-cycle",
)

items_counter.add(12, {"cycle.iteration": 1})
duration_histogram.record(54.7, {"cycle.iteration": 1})
Verify
A short-lived script exits before the batch processors' normal export interval elapses, so flush everything explicitly before returning:
from opentelemetry import trace, metrics
from opentelemetry._logs import get_logger_provider

trace.get_tracer_provider().force_flush()
metrics.get_meter_provider().force_flush()
get_logger_provider().force_flush()
A long-running server does not need this: its batch processors export on their normal schedule, and the SDK's default configurator also flushes everything on a graceful process exit.
Run the program, then confirm the data arrived:
up0 tail --type logs --since 15m
up0 tail --type traces --since 15m
Real output from a run of python/sdk against a live stack (token redacted,
already consumed by the process):
$ up0 tail --type logs --since 15m
2026-09-16T13:11:31.093338Z INFO  up0-example-python-sdk work cycle complete (iteration=1, items=11, duration_ms=54.70)
2026-09-16T13:11:31.301510Z ERROR up0-example-python-sdk boom: deliberate example failure occurred
2026-09-16T13:11:31.373177Z INFO  up0-example-python-sdk downstream http call complete (target=https://example.com, status=200)

$ up0 tail --type traces --since 15m
up0-example-python-sdk compute-batch 54508000ns Ok 3de4cf83221799e12f9b06d44f8f1fc8
up0-example-python-sdk work-cycle 54738000ns Ok 3de4cf83221799e12f9b06d44f8f1fc8
up0-example-python-sdk boom 658000ns Error 8912f76405bcb97f9d486b07e66d5b3b
up0-example-python-sdk GET 55174000ns Unset b346137ad2fe236f79f899baef689f19work.items.processed, one of the counters this program records, over the
same window (up0 metrics query --metric-name work.items.processed --since 15m --aggregation sum):
2026-09-16T13:11:24Z 2026-09-16T13:11:42Z 195.0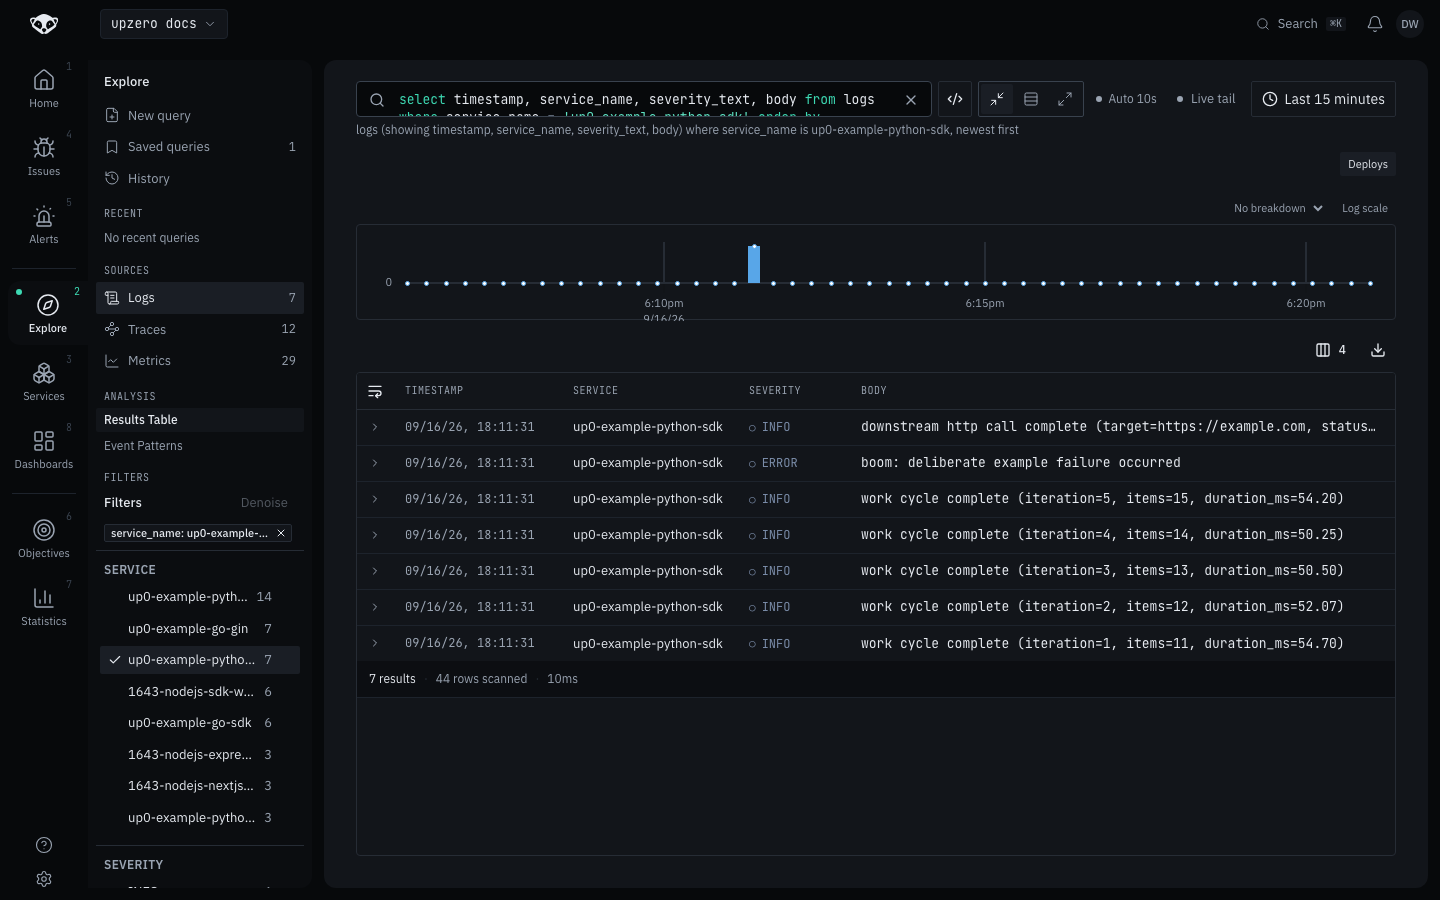
Troubleshooting
No logs arrive even though traces and metrics do.
OTEL_PYTHON_LOGGING_AUTO_INSTRUMENTATION_ENABLED=true was not set.
Confirmed by removing it from a working setup and re-running: traces and
metrics kept landing, up0 tail --type logs reported
No logs in the last 5m for the whole run. Without this variable,
opentelemetry-instrument never attaches the OTLP handler to Python's
logging module at all, regardless of logger level.
Logs arrive, but only ERROR ones, or none at INFO level.
Python's root logger defaults to WARNING. The OTel logging bridge exports
whatever reaches a handler, but a record that never passes the logger's own
level check never reaches any handler, including the OTel one. Call
logging.getLogger().setLevel(logging.INFO) (or configure the specific
logger you use) before logging at INFO.
A short program exits with up0 tail showing nothing.
The default batch processors buffer before exporting (5 seconds for spans
and logs, 60 seconds for metrics). A process that exits immediately after
its last log/span/metric call can exit before that interval, dropping
whatever was still buffered. Call force_flush() on all three providers
before your program returns, as shown above.