Building a dashboard
A dashboard is declared as a Perses-shaped manifest in git, not built in the console.
A Dashboard is a declared Kind. There is no dashboard builder in the console,
and there is no up0 command that creates one. POST/PATCH/DELETE on the
dashboards endpoint all return 405 on purpose. A dashboard exists because a
manifest was committed to your connected repository and applied by GitOps
sync, the same as a Monitor or a Rule.
Why no builder
Every other declared Kind in upzero goes through one write path, git, reviewed in a pull request (see Configuration as code). A console-only "create dashboard" button would give panels and layouts a second place to drift from what the repository says is current, which is exactly the problem the declared-Kind model exists to remove.
What a manifest looks like
spec adopts Perses' dashboard structure (display,
datasources, layouts, panels) under up0.io/v1, not Perses' own API
group. There is no embedded Perses server: panels are read and rendered
natively by the console against upzero's own data.
apiVersion: up0.io/v1
kind: Dashboard
metadata:
  name: service-overview
  labels:
    team: platform
spec:
  display:
    name: Service Overview
  datasources:
    default:
      display:
        name: upzero Data
      default: true
      plugin:
        kind: Up0DataSource # always this organization's own data
        spec: {}
  layouts:
    - kind: Grid
      spec:
        items:
          - x: 0
            y: 0
            width: 12
            height: 6
            content:
              $ref: "#/spec/panels/throughput"
          - x: 12
            y: 0
            width: 12
            height: 6
            content:
              $ref: "#/spec/panels/error_rate"
  panels:
    throughput:
      kind: Panel
      spec:
        display:
          name: payments-api request throughput
        plugin:
          kind: TimeSeriesChart
          spec:
            queries:
              - kind: Up0TelemetryQuery
                spec:
                  signal: metrics
                  serviceName: payments-api
                  metricName: http.server.request.count
                  aggregation: throughput
    error_rate:
      kind: Panel
      spec:
        display:
          name: payments-api error rate
        plugin:
          kind: TimeSeriesChart
          spec:
            queries:
              - kind: Up0TelemetryQuery
                spec:
                  signal: metrics
                  serviceName: payments-api
                  metricName: http.server.request.count
                  aggregation: errorRate
                  intervalSeconds: 300
metadata.name is the natural key: applying the same file again updates the
same row rather than creating a second dashboard.
The query per panel
A panel's plugin.spec.queries[] names a query plugin, not a raw query
string or PromQL expression. There is deliberately no SQL escape hatch.
Two plugins exist:
Up0TelemetryQueryis backed by the same Query API Explore uses.signalis alwaysmetrics.aggregationis a closed set of five values:errorRate,latencyP50,latencyP95,latencyP99,throughput.serviceNameandmetricNameare required;intervalSecondsis accepted for shape compatibility but the actual bucket width is chosen server-side and returned on the response, so it never needs to match exactly what you wrote.Up0MonitorUptimeQuery(monitorName,rangeHours) is declared in the Kind's spec but has no query handler behind it yet: a panel using it returns a 422, not data. Don't reach for it yet; it exists so the manifest shape doesn't need to change once it is implemented.
No query plugin has a field for an organization or tenant id. The panel's data always comes from your own organization's telemetry, resolved from your session the same way every other request is, so a manifest cannot be written to read someone else's data even by mistake.
Layout
layouts[].spec.items[] is a grid: x/y/width/height in grid units,
each pointing at a panel by $ref. The declared layout is honoured exactly
at desktop width and reflows on narrower viewports; an unusually tall panel
does not disturb its neighbours.
Connecting a repository
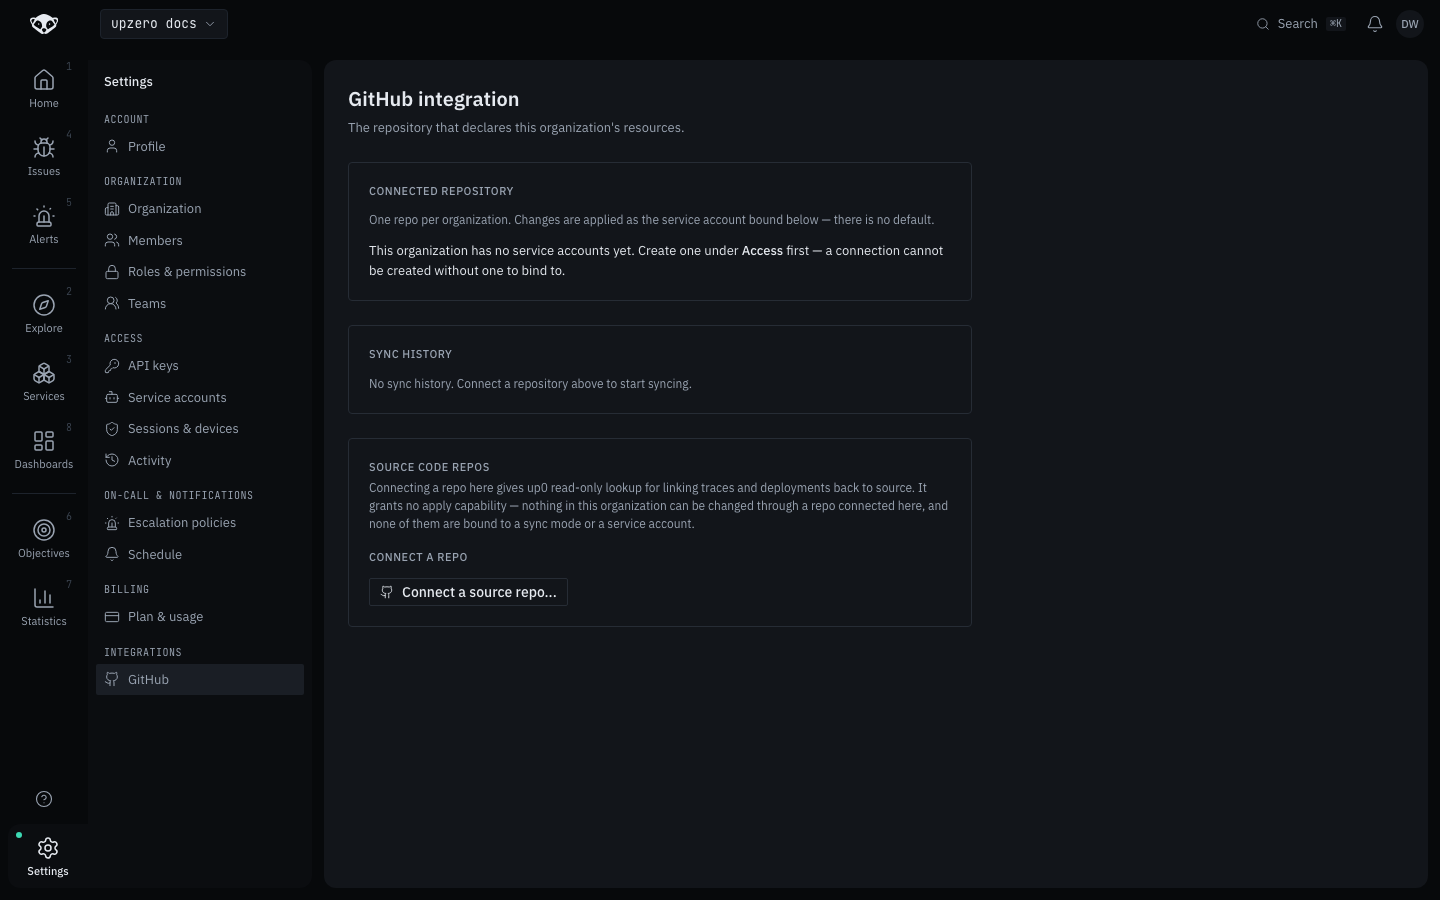
Applying a manifest at all needs a repository connection first, under Settings > Integrations > GitHub. A connection needs a service account to bind to (Settings > Access > Service accounts) before it can be created. There is one connected repository per organization, and it is always bound to a specific service account rather than a human session. See Configuration as code for the full setup.
Walked on kind
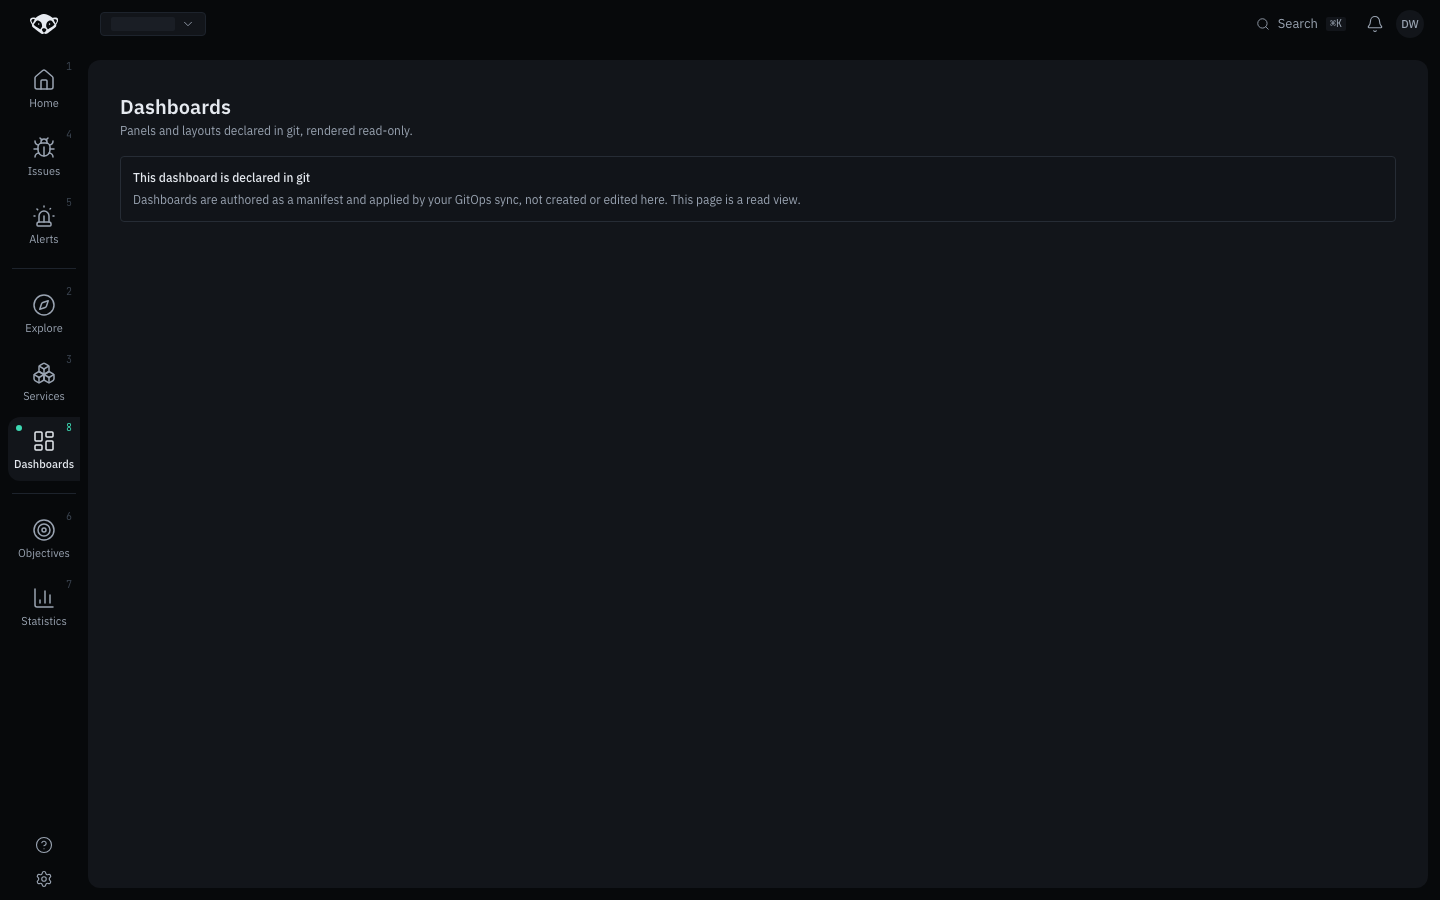
This organization has no repository connected yet, so /kinds/dashboards
below is genuinely empty. Connecting one needs a real sign-in on
github.com to authorize the app installation, which this walk could not
complete from a headless session (see the screenshot below for exactly
where the flow stops).
Once a manifest is pushed and applied, /kinds/dashboards lists every
dashboard the connected repository declares, and its detail page shows the
manifest path and the commit that last applied it. A real walk of this exact
path exists: docs/v2/testing/m08-dashboards.md's TC-M08-01 and TC-M08-04
pushed three manifests to a connected repository, replayed the signed
webhook, and confirmed the rendered dashboard matches the manifest exactly,
panel positions and sizes included, with real provenance (up0/dashboards/m08-walk.yaml
at a real commit).
For what each panel type actually renders once a dashboard is applied, see Panel types.