Topology
What the topology graph derives edges from, and what an isolated node means.
Topology
The topology map is one view of the whole organization's service graph: every discovered service as a node, and a directed edge wherever one service was observed calling another.
Where an edge comes from
An edge exists only because of real span parentage, never because two
services merely emitted telemetry around the same time. The derivation is a
bounded self-join over trace spans: a span in service B whose
parent_span_id matches the span_id of a span in the same trace,
belonging to service A, produces the edge A → B.
This runs against ClickHouse (otel.service_edges, an AggregatingMergeTree
kept fresh by the same roughly-ten-minute batch that runs discovery), not
against a relational edge table. Only the catalog's nodes live in Postgres;
edges are entirely derived from trace data and recomputed on schedule.
Two consequences follow directly from that join:
- A root span with no parent produces no edge and no invented node. A service that only ever appears as the start of a trace shows up as a node with no edges, not as a phantom "unknown" caller.
- A service calling itself does not draw a self-edge. The join
deliberately excludes
child.service_name == parent.service_name, so a service that talks to its own replicas does not clutter its own node with a loop.
Cycles between two real services (A → B → A) are recorded as two separate
directed edges and render normally. The layout does not require the graph
to be acyclic.
Reading an edge
Each edge carries three numbers, computed from the same window the graph is viewing: request count, error rate, and p95 latency. They move when the underlying traffic moves, and they reflect exactly the calls that produced the edge, not the receiving service's traffic as a whole.
An edge is also colored by health, read from its own error rate: 10% or higher is "down", 1% or higher is "degraded", anything lower is "healthy". An edge with no requests at all in the window is "no data", kept visually distinct from a verified-healthy one rather than defaulting to it, since a silent dependency is not the same claim as a checked one. Line thickness scales with request volume, so a heavily-used path reads as heavier than an occasional one at a glance.
What an isolated node means
A node with no edges at either end is a service the topology derivation has never seen call, or be called by, anything else. There are two honest reasons for that:
- It genuinely has no cross-service traffic yet (a batch job, a worker polling a queue, anything that only emits root spans).
- Its calls carry no span parentage the join can use, for example a caller that talks to it over a protocol not covered by your instrumentation.
Either way, an isolated node is not an error state. The map draws it as an unconnected box, and nothing in the product tries to guess an edge into existence.
Freshness and the time range
The map reuses the same time-range picker as Explore, so you can widen or narrow the window the same way. Because edges are a derived batch, not a live query, a service you just wired up to call another will not show the edge immediately. If an edge you expect is missing, widening the range rules out a window problem before you go looking for an instrumentation one.
Empty states
An organization with no cross-service calls at all (including one with several active services, each running in isolation) draws every node with no edges between them; there is no separate "no edges" message, the unconnected nodes are the answer. An organization with no services discovered yet says so directly: "No service dependencies observed yet," with a reminder that the graph is derived on its own schedule and an action to try a wider range.
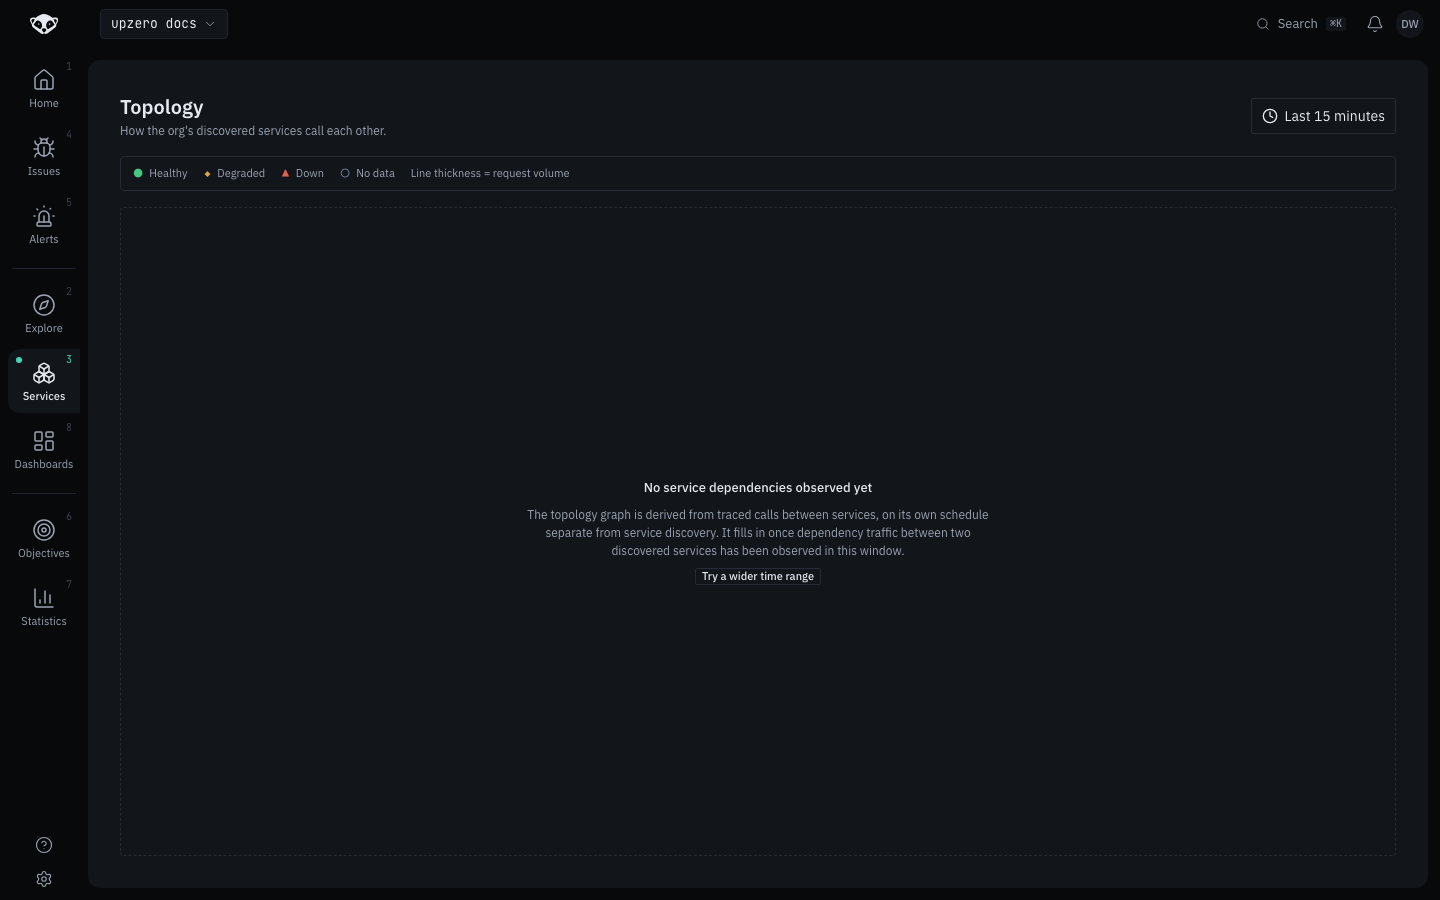
Captured as the empty state
This screenshot is the real, walked topology page on the local kind
cluster, not a mockup. It shows the empty state rather than a populated
graph because the Temporal workers that run discovery and topology
derivation (correlation-harness-fast/-slow) are disabled by default in
both kind profiles (deploy/charts/up0/values.yaml, decision #903), and
the shared cluster this walk ran against had neither running. Traces sent
directly to the OTLP endpoint during this walk were confirmed queryable
through the telemetry Query API, so ingestion itself works; only the
derivation batch that turns those traces into catalog rows and edges had
no worker to run it here. A populated graph, with real edge counts and
p95 figures produced against seeded traffic, is recorded in
docs/v2/testing/m03-service-catalog.md (TC-M03-12 and TC-M03-13).