Traces
What the Traces view shows, the span waterfall, and the service map a trace's calls draw.
Traces
Pick Traces in the sidebar, or write a query with from traces.
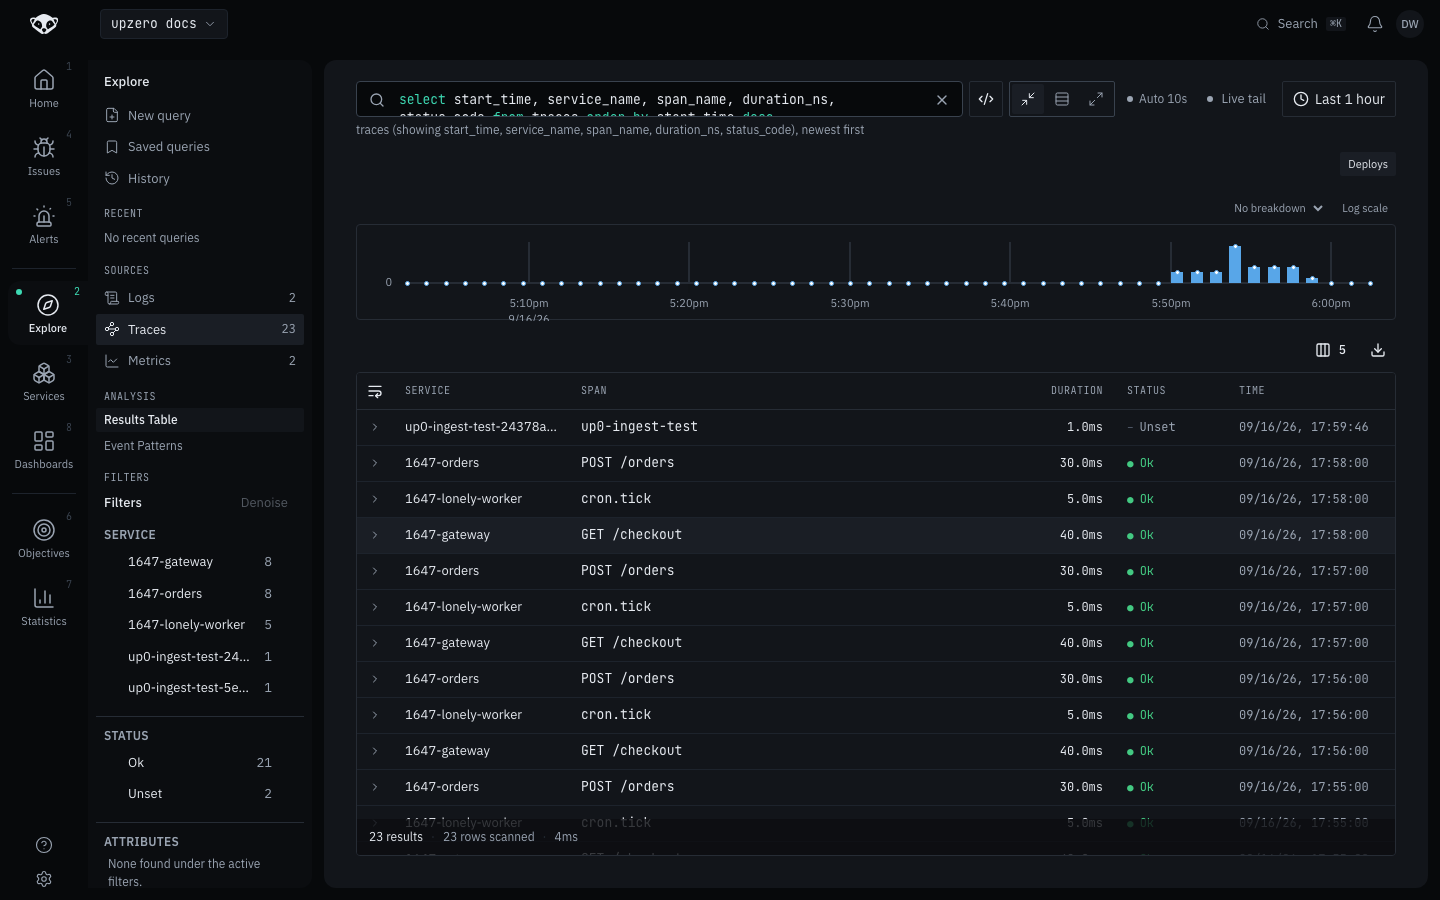
Columns
| Column | Meaning |
|---|---|
trace_id | Groups every span that belongs to the same request |
span_id | This span |
service_name | Which service emitted this span |
span_name | The operation name (GET /checkout, cron.tick, ...) |
duration_ns | Span duration, in nanoseconds |
status_code | Ok, Error, or Unset |
start_time | When the span started |
Traces has no timestamp column; it is start_time. Writing select timestamp from traces is the single most common mistake against this
source, and the parser names it exactly (see
Query language).
Sorting and filtering
order by only accepts start_time. The backend's keyset cursor for
traces is typed against it, the same as timestamp is for logs. The facet
panel filters by service_name and status_code (traces' equivalent of
logs' severity_text), plus every attribute and resource attribute your
spans carry.
The waterfall
Opening a row's detail panel loads every span in that trace and lays them out as a waterfall: one row per span, indented under its parent, with a timing bar showing where it fell within the trace and how long it took.
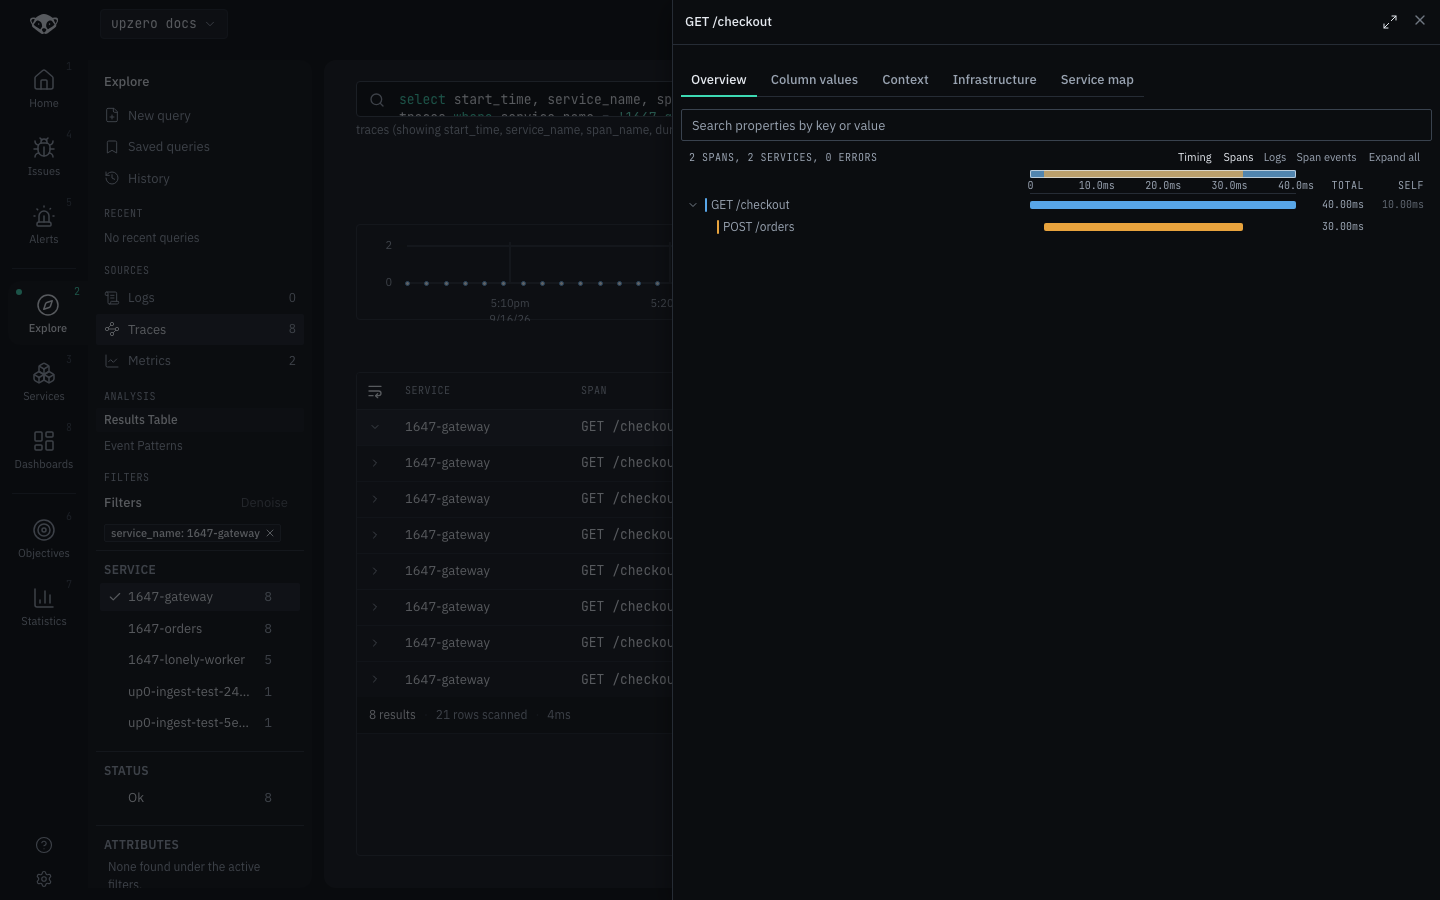
The header line (2 SPANS, 2 SERVICES, 0 ERRORS above) is a fast read on whether a trace is worth opening at all before you scroll it. TOTAL is wall-clock time including children; SELF is time spent in that span alone, so the gap between the two is where the child calls went. Expand all opens every collapsed child span at once on a deep tree.
The panel itself has five tabs: Overview (the waterfall, shown above), Column values, Context, Infrastructure, and Service map (below), the same five every record's detail panel offers, whichever source you opened it from.
Service map
The Service map tab turns the same trace into a call graph: which service called which, and how many times, for this one trace.
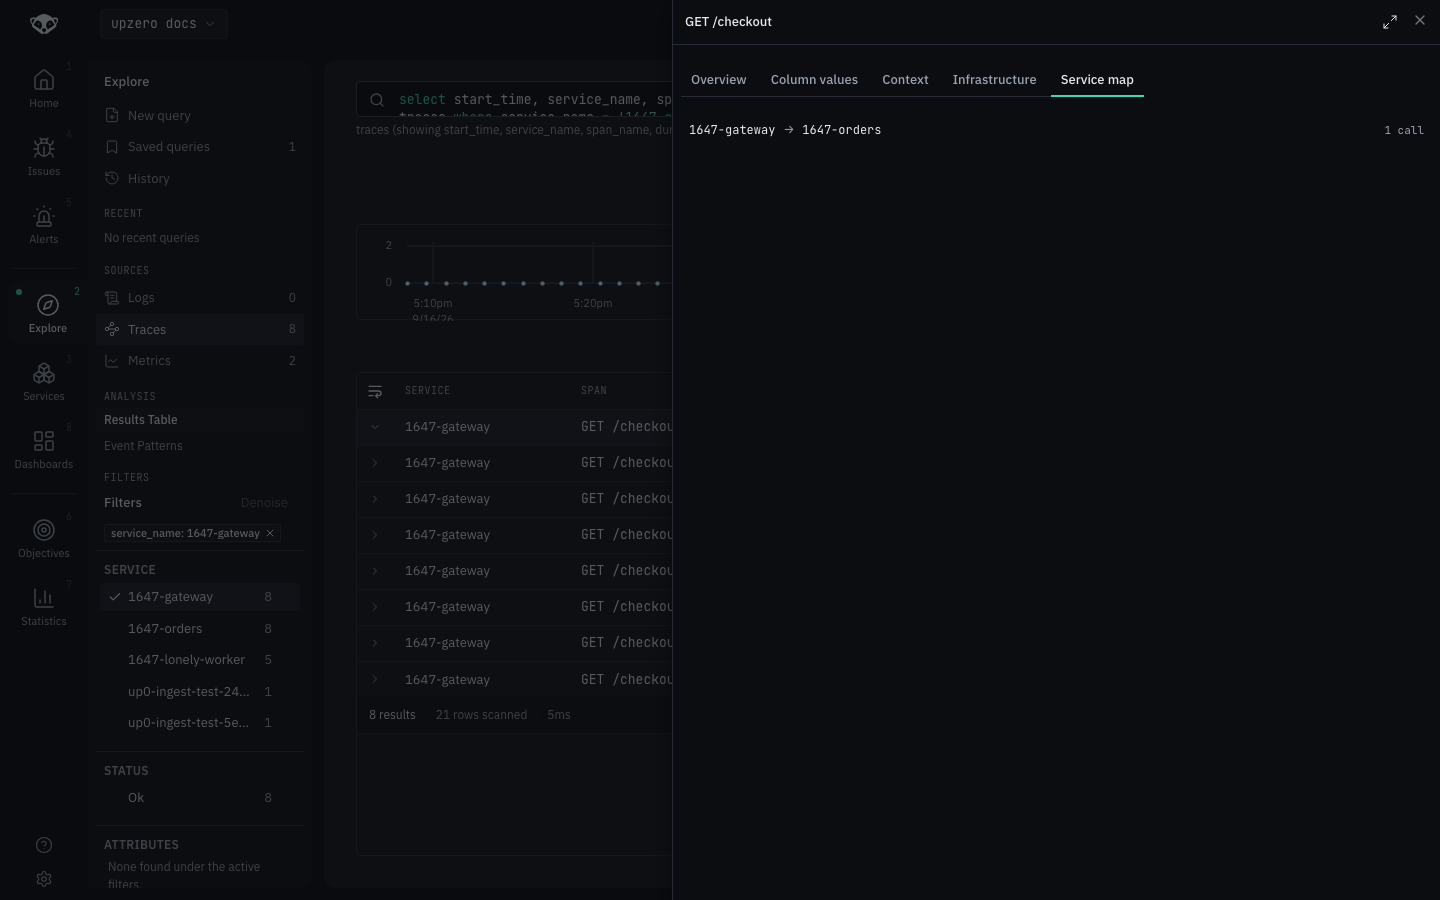
This is the narrowest, most literal service map upzero draws, scoped to a single trace rather than an aggregate over your whole fleet. For the aggregate view across every trace in a window, see the Services section.
From a log
A log that carries trace_id links straight into this same waterfall. See
Logs for the View trace → action and what happens when trace_id was not selected.