Logs
What the Logs view shows, the facet panel, the histogram, and drilling from a log into its trace and the services that handled it.
Logs
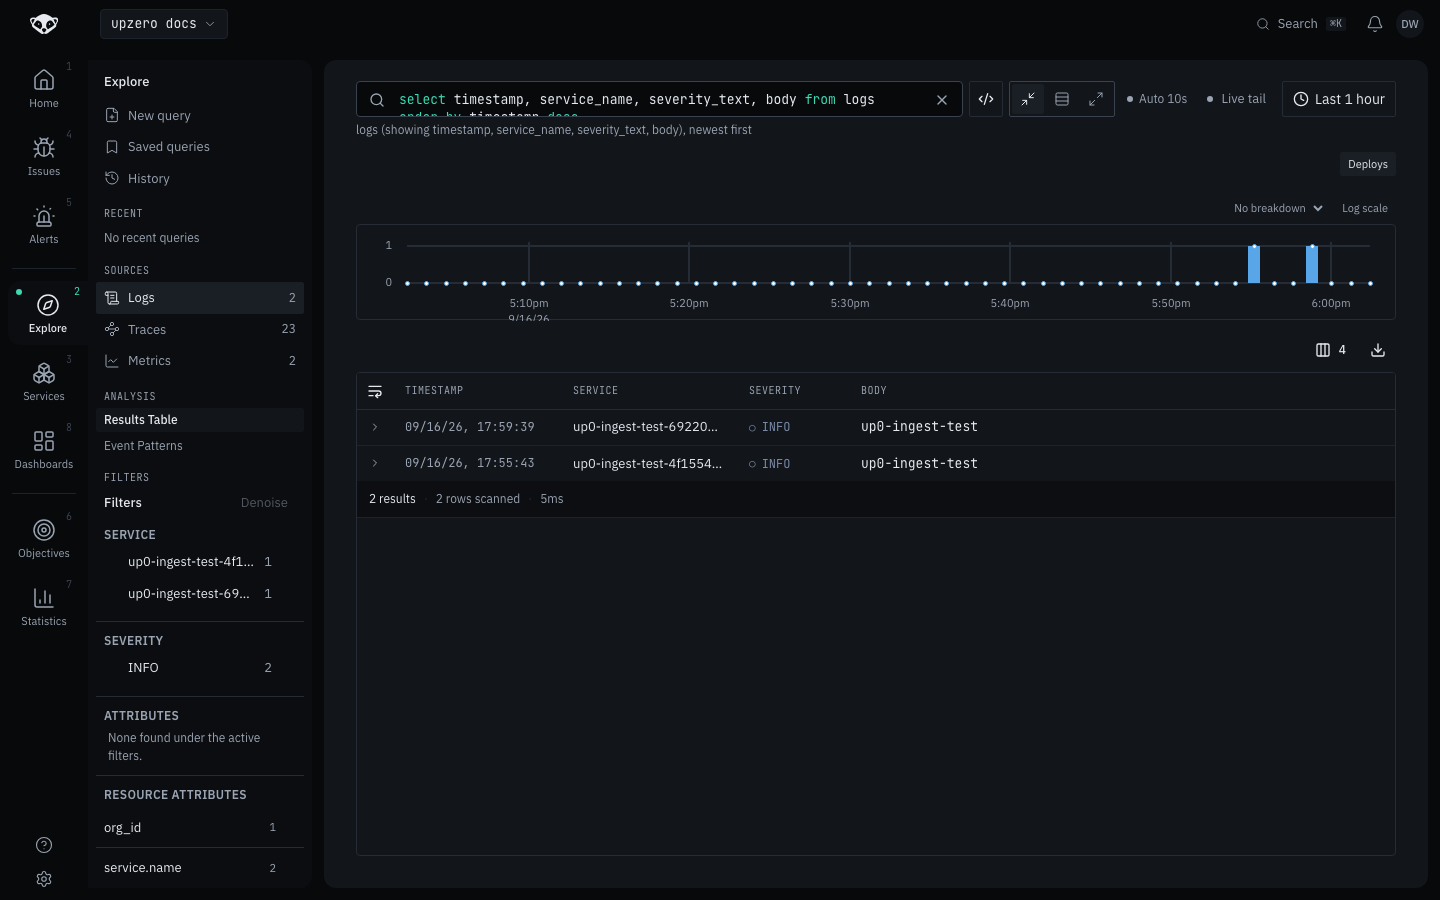
Pick Logs in the Explore sidebar, or write a query with from logs in
the search bar. The two stay in sync: switching sources rewrites the query's
from, and typing a query with a different from switches the sidebar
selection.
Columns
Every field the log record carries:
| Column | Meaning |
|---|---|
timestamp | When the log was recorded |
trace_id | The trace this log belongs to, if it was emitted inside one |
span_id | The span within that trace |
service_name | The emitting service |
severity_text | Log level (INFO, WARN, ERROR, ...) |
severity_number | The numeric OTel severity, for >/< comparisons in a query |
body | The log message |
select * returns every column. Naming columns narrows the table, which
helps when body is long and you only want to scan service_name and
severity_text side by side.
The facet panel
The left panel lists the top values for service_name, severity_text, and
every attribute and resource attribute your logs carry in the current
window, each with a count. Clicking a value edits the query's where clause
for you, so you never have to hand-write the attr:'...' = '...' form to
filter on an attribute your own instrumentation set.
Facet counts are computed by the backend over the active filters, not estimated client-side, so what you see in the panel always agrees with what the results table returns.
The histogram
Above the table, a bar per time bucket shows record volume across the
selected range. No breakdown groups everything into one series; choosing
a breakdown splits each bar by severity_text, the one dimension the
backend's histogram endpoint can group by for logs (it is a fixed boolean on
the endpoint, not an arbitrary column).
Drilling from a log into its trace
A log emitted inside a trace carries that trace's trace_id. Open a row's
detail panel and, when trace_id was selected, a View trace → action
opens that trace's waterfall directly, the same view Traces
describes, scoped to just that one trace.
If trace_id was not in the projection (a narrow select that left it out),
the detail panel says so plainly rather than rendering a dead button: "This
row has no trace_id — the query projected it out, so its span tree cannot be
loaded. Add trace_id to the selected columns."
From the trace's waterfall you can go one step further, to the Service
map tab, which shows which services called which for that trace: the
log → trace → service path in one set of clicks. See
Traces for what that view shows.
Live tail
Live tail, next to the time range picker, switches the table into a
following mode that polls for new matching records and appends them at the
bottom. It is the console's version of up0 tail --type logs (see
From the terminal), for when you want to watch logs
arrive without leaving the browser.