Statistics
What an organization holds, how far back it goes, and why the on-disk size is always an estimate.
Statistics
Statistics (its own top-level rail item, not nested under Settings: it is a surface you come back to, not a one-time configuration screen) answers what your organization's telemetry actually amounts to: how much, of what signal, since when, and how it is changing.
Statistics are not billing
This page is a different thing from your billing usage bars in Plan and usage. Billing meters ingestion volume with an immutable, anti-double-bill ledger. Statistics are derived, freely recomputable facts about what is currently stored. They are approximate where exactness would be expensive, and never the number an invoice is built from.
Held totals
Per signal (logs, traces, metrics), two kinds of total, always all-time and independent of whatever range the page's own selectors show:
- Event count: an exact row count.
- Estimated disk bytes: never an exact figure. ClickHouse reports on-disk size per table and partition, and every organization shares those partitions, so there is no way to read one tenant's exact on-disk share back out. The method is to accumulate each organization's own uncompressed bytes and apply the table's overall compression ratio. That is why every surface that shows it, including this one, labels it an estimate rather than a measurement.
up0 stats shows the same two tables the console does, without needing a
time range:
up0 --profile kind stats Held totals (all-time)
┏━━━━━━━━━┳━━━━━━━━━━━━━━━━━━━━━━┳━━━━━━━━━┳━━━━━━━━┳━━━━━━━━━━┳━━━━━━━━━━━━┓
┃ SIGNAL ┃ METRIC ┃ TOTAL ┃ UNIT ┃ ESTIMATE ┃ DATA START ┃
┡━━━━━━━━━╇━━━━━━━━━━━━━━━━━━━━━━╇━━━━━━━━━╇━━━━━━━━╇━━━━━━━━━━╇━━━━━━━━━━━━┩
│ traces │ event_count │ no data │ events │ │ - │
│ logs │ event_count │ no data │ events │ │ - │
│ metrics │ event_count │ no data │ events │ │ - │
│ traces │ uncompressed_bytes │ no data │ bytes │ │ - │
│ logs │ uncompressed_bytes │ no data │ bytes │ │ - │
│ metrics │ uncompressed_bytes │ no data │ bytes │ │ - │
│ traces │ estimated_disk_bytes │ no data │ bytes │ yes │ - │
│ logs │ estimated_disk_bytes │ no data │ bytes │ yes │ - │
│ metrics │ estimated_disk_bytes │ no data │ bytes │ yes │ - │
└─────────┴──────────────────────┴─────────┴────────┴──────────┴────────────┘
totals above are all-time, not scoped to any --from/--to range; ESTIMATE=yes
means a compression-ratio estimate, not an exact measurement
Retention
┏━━━━━━━━━┳━━━━━━━━━━━━━━━━━━┳━━━━━┳━━━━━━━━━━━━━━━━━━━━━━┳━━━━━━━━━━━━━━━━━┳━━━━━━━━━━━━━━━━━━━━┓
┃ SIGNAL ┃ OLDEST DATAPOINT ┃ AGE ┃ CONFIGURED RETENTION ┃ DISTINCT SERIES ┃ DISTINCT ATTR KEYS ┃
┡━━━━━━━━━╇━━━━━━━━━━━━━━━━━━╇━━━━━╇━━━━━━━━━━━━━━━━━━━━━━╇━━━━━━━━━━━━━━━━━╇━━━━━━━━━━━━━━━━━━━━┩
│ traces │ - │ - │ 90 d │ - │ - │
│ logs │ - │ - │ 30 d │ - │ - │
│ metrics │ - │ - │ 395 d │ - │ - │
└─────────┴──────────────────┴─────┴──────────────────────┴─────────────────┴────────────────────┘Zero and absent are different, on purpose
A total that comes back null prints as the literal no data,
never as 0. A rendered 0 is always a genuine
computed reading (nothing has been ingested since a real zero-row query
ran). Conflating the two is exactly the mistake this milestone exists to
prevent, so the CLI and the console both keep them visibly distinct.
Every row above reads no data because the org-statistics derivation runs on
the same Temporal correlation harness as Services and Issues, and that
harness is disabled on this kind cluster by default (its namespace quota
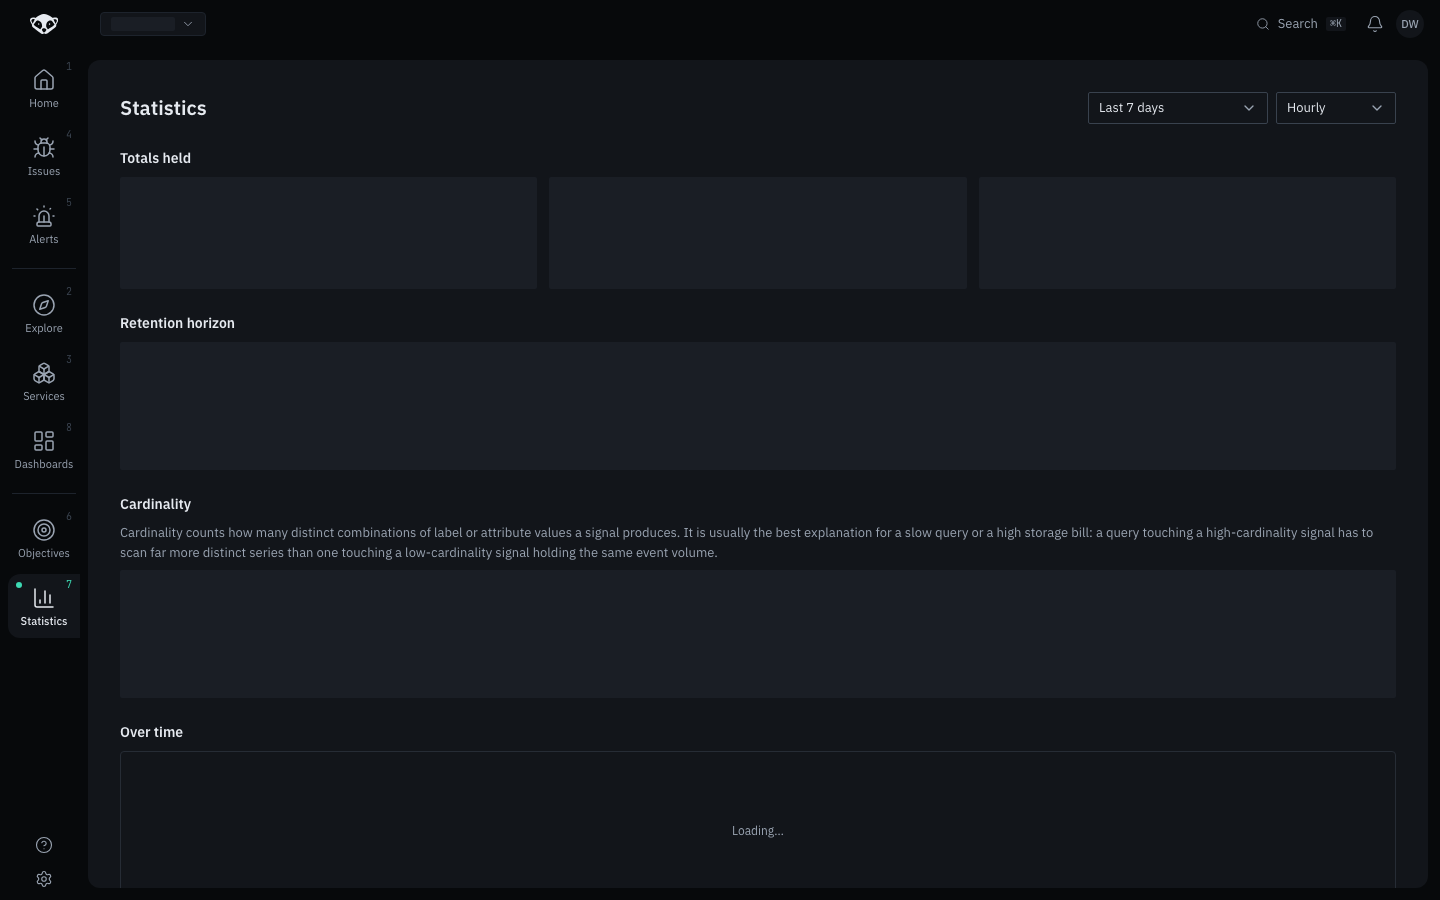
cannot fit it). The console page shows the identical shape: the layout
renders, every value area stays empty rather than showing a wrong number.
Retention horizon
The real oldest datapoint per signal, next to your plan's configured retention window, so you can see how those two numbers actually compare rather than assuming your data reaches back as far as the setting claims.
Cardinality
Distinct series and distinct attribute keys per signal. Cardinality is usually the real explanation behind a slow query or a surprising storage bill: a high-cardinality signal has to scan far more distinct series than a low-cardinality one carrying the same event volume, even when the two hold the same number of rows.
Breakdown and over time
The page also breaks totals down by service and by ingestion token, and plots change over a selectable range and bucket size (hourly or daily). Both depend on the same harness as the totals above, so they were not exercised live on this walk.
--from / --to
Unlike metrics query's --since, up0 stats takes only absolute ISO 8601
timestamps for --from/--to, because the read API itself has no relative-time
parameter. A bare up0 stats still sends a cheap, throwaway one-hour window
under the hood to satisfy the API's required range, but only renders the
range-independent totals and retention tables shown above; the per-bucket
series table only appears once you pass --from, --to, or --bucket
yourself.