Service catalog
Services are discovered from telemetry, never created by hand. The six annotations, where to set them, and what status means.
Service catalog
A service in upzero is never created. It is discovered: the moment a
span, log or metric carrying a service.name resource attribute reaches
your organization, a background workflow writes a row for it. There is no
"Add service" button anywhere in the console, no POST /api/v1/services,
and no up0 services create. If you want a service in the catalog, send it
telemetry under that service.name.
Discovery is a batch, not instant
A new service is not visible the second its first span lands. Discovery runs on its own schedule, targeting roughly ten minutes of freshness. If a service you just started emitting from is missing, wait a cycle before assuming something is wrong.
What gets written
Discovery owns exactly four columns on a service row: name, first_seen_at,
last_seen_at and status. Each discovery pass upserts on (org_id, name),
so re-observing a known service advances last_seen_at and never creates a
second row, no matter how many times the batch runs.
status is one of two values:
| Status | Meaning |
|---|---|
active | Telemetry has arrived recently. |
dormant | Nothing has been seen from this service for over an hour. |
A dormant service is not deleted and does not disappear. Its row, and any annotations on it, stay exactly where they are. The catalog is a Postgres table, not a view over telemetry, precisely so a service survives its signals aging out of ClickHouse's retention window: a quiet service should read as quiet, not vanish along with data it never depended on to exist.
Renaming a service on your side (a new service.name on the next deploy)
is not a rename to upzero. The old name goes dormant on its own schedule and
the new name is discovered as a new row. Nothing merges the two by guesswork.
Discovery is scoped to your organization
Two organizations can send telemetry under the identical service.name and
each ends up with its own row. The natural key is (org_id, name), not
name alone, so there is no cross-tenant collision and no visibility into
another organization's services, however they are named.
Annotations
Discovery never writes an owner, a tier, an environment or a link. Those six fields are annotations, and they are the one thing a human (or a manifest) is allowed to set:
| Field | Purpose |
|---|---|
owner | Team or person responsible |
tier | Free-form criticality label, with no fixed vocabulary |
environment | Free-form deployment environment |
repoUrl | Link to the service's source repository |
runbookUrl | Link to its runbook |
dashboardUrl | Link to its dashboard |
All six are optional, all six are plain strings, and the three link fields
must be an absolute http:// or https:// URL if set at all. A bare
string like not a url or a javascript: scheme is rejected.
You can set them three ways:
Open a service's detail page and use the annotation editor beneath its identity and links section. The form opens pre-filled with whatever is already set, not blank fields, and clearing a field back to empty is a real action, distinguishable from never having set it.
The list
Open Services in the console to see every service discovered in your
organization, filterable by status and by tier. Both filters live in the
URL, so a filtered view is a link you can share. A filter that matches
nothing says so directly ("Services exist in this organization, just none
with the current status or tier"), which reads differently from an
organization with nothing discovered at all.
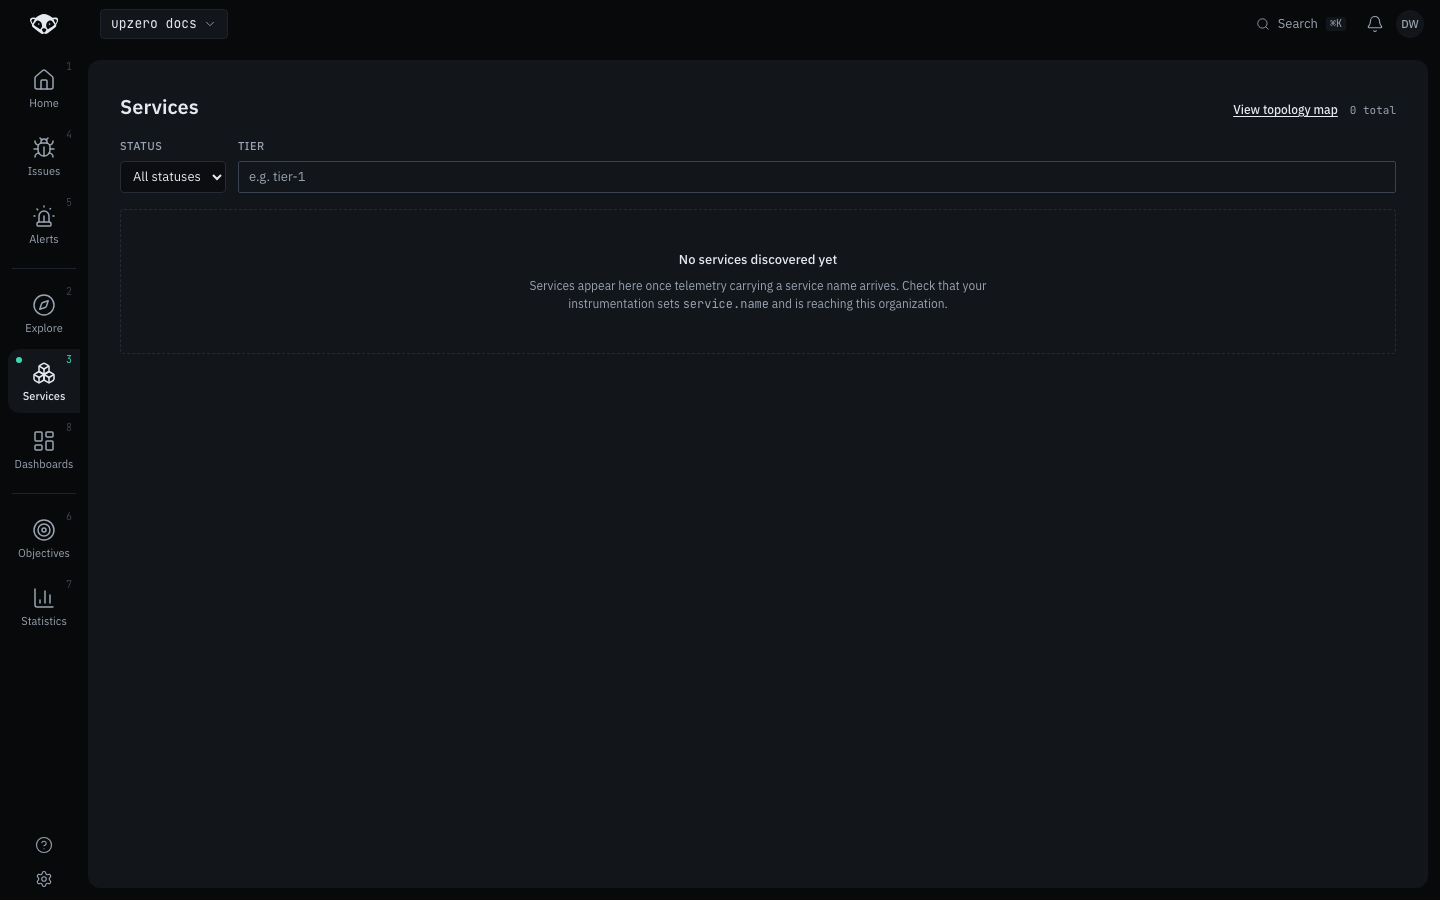
Before any telemetry has arrived, the list explains what would make
something appear rather than leaving a blank panel: "No services discovered
yet. Services appear here once telemetry carrying a service name arrives.
Check that your instrumentation sets service.name and is reaching this
organization."
Seeing it happen
Send a synthetic signal and watch a service appear:
up0 tokens create --name ci-token --signals traces
up0 ingest test --signal traces --token <token>
up0 ingest test sends one span under a generated service.name and polls
the Query API until it lands, confirming ingestion works end to end. The
service itself will not show up in the catalog until the next discovery
cycle runs, roughly ten minutes later, even though the signal itself arrives
in seconds.
Discovery is off by default on a local kind cluster
The Temporal workers that run discovery (correlation-harness-fast/-slow)
are disabled by default in both kind profiles
(deploy/charts/up0/values.yaml, decision #903). Traces sent to a local
kind cluster's OTLP endpoint are ingested and queryable immediately, but no
service row appears in the catalog until that worker is enabled and has
run at least one cycle. The same is true on staging today, so do not
expect a populated catalog there either. This is an environment default,
not something a production deployment does.